Bear markets always give plenty of advance warning, says MoneyShow's Tom Aspray, and he demonstrates how a widely followed economic indicator can be combined with the market internals to give you advance warning of a bear market.
The new all time highs in most of the major averages over the past two weeks has reduced the number of bearish articles on the stock market, but don’t expect that to last for too long. In late January and early February, the new bear market articles reached a high level, which was part of the reason I focused on some of the market’s past major corrections in Tell Tale Signs of a Correction.
I was very pleased with the response to this trading lesson as it received over 75,000 page views in the first few days after it was released. The article focused on the type of patterns and warnings one can get from the NYSE Advance/Decline before a significant stock market correction.
In the follow-up article (More Correction Warning Signs) I looked at some of the short-term corrections that can take the S&P 500 down 6-12% from its highs. As I noted, these are sometimes more difficult to spot in advance as they are often much shorter in duration.
In this week’s trading lesson, I want to concentrate on the recent bear markets to see how an investor or trader can use economic data along with technical analysis to gain advance warning of an impending bear market. There are currently no signs that we are even close to a bear market, in fact, I think it is more likely that stocks will melt up.
There is a very close correlation between bear markets and recessions as stocks generally top out before the economy officially enters a recession. Therefore, a key part of my market analysis is to follow a number of economic indicators. My favorite is the Conference Board’s Leading Economic Indicator (LEI). It is a composite of ten fundamental indicators and is reported monthly.
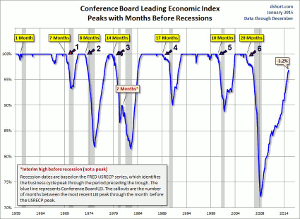
As the excellent chart from www.dshort.com demonstrates, it has a good record of peaking out well before economy enters a recession. I have added annotations to the chart for this discussion. For example, the recession in 1969-1970 started in December 1969 but the LEI peaked seven months ahead of the recession, point 1, in May 1969.
The bear market in 1973-1974 was the most severe since the crash of 1929 as the recession started in November 1973. The LEI peaked eight months earlier in March 1973, point 2. On the chart, I have identified six different bear markets, and in 1979-1982, there were officially two different recessionary periods.
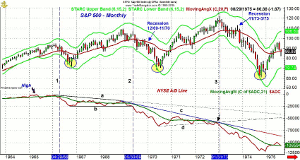
Between the late 1960s and 1975 there were actually two bear markets. Therefore, I am using a monthly chart of the S&P 500 and NYSE A/D line to cover the entire period. The monthly and weekly NYSE A/D line peaked in April 1965 and then formed lower highs in early 1966. By April 1966, line 1, the A/D line had started a new downtrend as it had dropped below its declining WMA and the prior low.
The S&P 500 finally bottomed out six months later, and from high to low, the S&P had declined 23.6%. Now this crossed the 20% threshold for a bear market, but the decline only lasted ten months and the economy was not in a recession. In the three months when the S&P 500 was bottoming out, the monthly starc- band was tested.
NEXT PAGE: What’s the W-Shaped Recession?
On the rally from the October 1966 low to the December 1968 high, the monthly NSYE A/D line was very weak as it never started a new uptrend. At the 1968 high, the A/D line was below the peak from 1967, so further divergences were formed. In February 1969 the A/D line dropped below its WMA, and in May 1969, the major support at line b, was violated (line 2). Seven months later in December 1969 the economy officially entered a recession. The LEI (see point 1, Fig1) peaked In May so it supported the negative signals from the monthly A/D line.
By the time the recession was officially over in November 1970, the S&P had already rallied 27% from its low. As the S&P 500 continued higher in 1971 and in 1972, the monthly A/D line formed lower highs. The A/D support at line d, was broken in July 1972, and as the S&P was making new highs, the A/D line was only able to rally back to its declining WMA (see arrow). When the S&P 500 made its high on January 31, 1973 (line 3), the A/D line was already declining.
The recession officially began ten months later in November 1973 but the LEI had peaked in March. This was eight months before the start of the recession and two months after the A/D line had dropped below support. This bear market lasted 622 days as the S&P 500 declined over 48%, finally bottoming in October 1974.
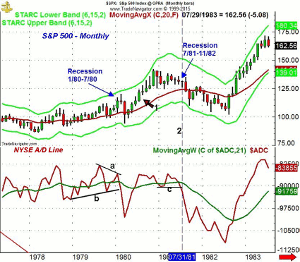
In an effort to fight the raging inflation, Paul Volcker started to raise rates in 1979. Between 1979 and June 1981 the Fed Funds rate rose from 11.2% to 20%. This resulted in what some refer to as the “W-shaped recession” of the early 1980s. The first phase began in January 1980 and was over by July of the same year.
The S&P 500 actually made its high in February 1980 but it was accompanied by lower highs in the monthly NYSE A/D line (line a). The uptrend in the A/D, line b, was broken in February with the S&P 500 making its low of 94.23 in March. This decline of 17.1% took just 44 days as the recession was over in July (point 1).
The S&P rallied to a new high in November 1980 but the A/D line stayed well below the peaks from 1978 and 1979. The S&P traded in a fairly tight range for the next eight months as the second recession started in July 1981. This coincided with a drop in the A/D line on July 31, 1980 (line 2) below the six month support at line c.
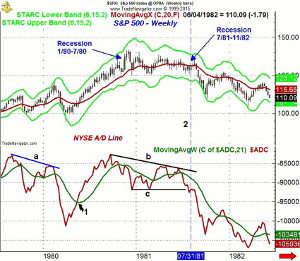
The weekly chart of this time period shows that the NYSE A/D line formed a significant negative divergence at the February highs as it diverged sharply from prices as indicated by line a. The S&P 500 peaked the week ending February 15. The A/D line dropped below its WMA the next week. It declined sharply for five weeks before turning higher in April.
The A/D line moved back above its WMA in the middle of May and the S&P 500 subsequently rallied over 32% before it peaked in November 1980. The A/D line formed important support in late 1980 and early 1981 (line c). This support was decisively broken on July 31, 1981 but the S&P rallied for two more weeks before it collapsed.
This bear market lasted 614 days and dropped the S&P 500 by 27.1%. The LEI peaked in September of 1979, which was 14 months before the first recession (point 3 on Fig1). The LEI formed a secondary peak between the recessions and never really rallied before it—again—turned lower.
NEXT PAGE: Here Comes the Dot.com Bear
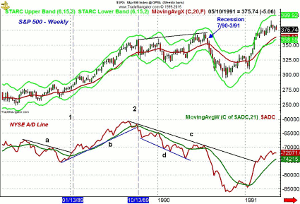
|pagebreak|The recession from July 1990 to March 1991 was brief and this chart covers the stock market history that led up to the recession. The Federal Reserve had been raising rates since 1986 as the A/D line had been in a downtrend for most of 1988. This downtrend, line a, and the WMA were overcome on January 13, 1989 (line 1), which was the start of a nine month rally.
By April, the A/D line was in a well established uptrend, line b, that was not broken until October 13, 1989. The A/D line had formed a six-week negative divergence, line c, prior to the break of support. The S&P 500 declined 11% in the next four months before resuming its uptrend. As the S&P 500 made higher highs, the A/D line was making lower lows (line d), which was a sign of weakness.
As the S&P peaked in July of 1990, the A/D line had formed much lower highs as it just rallied back to the bearish divergence resistance at line c. This was in contrast to the higher highs in prices, line b. The resulting decline of 19.9% only lasted 85 days.
The A/D line was forming a bottom in early 1991, and by January 25, it had started a new uptrend. The bearish divergence resistance in the A/D line was overcome a month later. The LEI had peaked well ahead of the market as it topped out in May 1989 (point 4, Fig1) when the S&P was in the midst of its nine month rally.
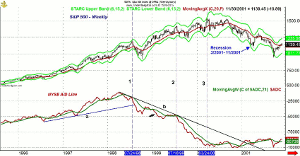
The dot.com bear market had the same impact on a generation of many investors as the 1973-1974 decline as many avoided the stock market for the rest of their lives. The NYSE A/D line had started a new uptrend in early 1995 as it held above support even during the correction in 1996. The short-term uptrend from the 1996-1997 lows (line a) had become an important level of support at the beginning of 1998.
The A/D line peaked in April 1998 and then dropped below its WMA six weeks later. When the S&P 500 moved to a convincing new high the week of July 17, the A/D line only rallied back to its declining WMA, forming a pronounced negative divergence, line b. The two year support in the A/D line was broken on July 24 (line 1).
This 19.3% correction was discussed in Tell Tale Signs of a Correction . The correction was over by early November as the A/D line had reached support from the 1997 lows. As the S&P 500 continued to rally in early 1999, the A/D line stayed weak as it made a new correction low in February.
By July 16, 1999 the S&P 500 was 19% above the July 1998 high, but the A/D line has just rallied back to its downtrend, line b. Just two weeks after the S&P high, the A/D line was again dropping to new lows. It continued to plunge for the rest of the year as it was sharply diverging from prices. This reflected the fact that most stocks were declining, but the highest capitalization stocks were still rising, so the S&P 500 kept moving higher.
The recession officially began in March 2001 and ended in November 2001. As noted in Fig1 (point 5), the LEI peaked ten months earlier in May 2000, which was just after the S&P 500 topped out. The bear market lasted 915 days as the S&P 500 did not bottom until October 2002. The S&P lost 49.1% during this bear market.
NEXT PAGE: Was Resistance Ever Overcome?
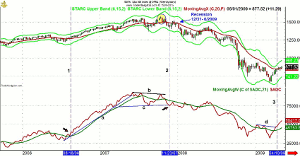
|pagebreak|From May through early August of 2006, the S&P 500 corrected, but by August 18, 2006 (line 1), the A/D line had turned positive as the S&P 500 closed at 1302. The A/D line began to rally very sharply by early October as it was in the acceleration mode .
The A/D line stayed well above its rising WMA, even during the 6.7% correction that took place in March 2007. In early June, the A/D line peaked and one week later it dropped below its uptrend, line a, as the S&P 500 closed at 1507. It had gained 15.7% since the A/D line buy signal in August 2006.
The S&P 500 soon pushed to another new high in July but the A/D line formed lower highs, as indicated by line b. One week after the high, the S&P 500 dropped sharply as it lost 5% and the A/D line moved below its WMA. The selling continued into August as the A/D line dropped to support from March, line c.
The S&P 500 declined 11.8% from high to low but the A/D lost over 17%, which was a sign of weakness. By the end of August, the A/D line had turned higher, and a month later it moved back above its WMA. The week ending October 12, the S&P made a new high at 1576 as a doji was formed (see circle).
The A/D line again failed to make a new high as it just rallied back to the bearish divergence resistance at line b. The week after the S&P made its high, a low close doji sell signal was triggered.
The week ending November 23, the A/D line dropped below the support at line c. In the following three weeks, the S&P rallied back above its 20-week EMA, but the A/D line stayed well below its declining WMA.
The recession officially started on December 31, 2007 and technically lasted until June of 2009. As you can see in Fig1, the LEI peaked in April 2005, which was 20 months before the official start of the recession.
In March 2009 the S&P 500 made a low of 666, which was just below the weekly starc- band at 672. By the end of the month, the A/D line had moved above its WMA. The A/D line resistance at line d, was overcome on April 10 (line 3).
I hope that this review of past bear markets has shown you how the LEI can be a valuable tool to use along with the A/D line to identify bear markets in advance. I encourage you to start following the LEI. It is reported each month by the Conference Board as they always issue a press release . The February update is scheduled for March 19.
I would suggest you set up at least a weekly schedule to monitor the weekly and daily NYSE A/D lines. Watch not only for long-term but also short-term divergences between the A/D line and prices. If weekly divergences are spotted in the A/D then wait for the A/D line to drop below support. This will signal that a correction is underway. If the LEI has been declining for several months when this occurs, then a bear market may be starting.

