Blake Robben of Archer Financial Services explains how the Fibonacci sequence is not only for financial chart analysis, but can also be applied to all living things. He points out the most popular Fibonacci retracements and highlights the different technical uses.
Fibonacci retracements are ratios that are used to identify potential areas of support on a partial reversal of a price move. In addition, Fibonacci retracement patterns can be useful for traders to identify reversals. Fibonacci numbers were developed by Leonardo Fibonacci, an Italian mathematician who is considered to be the most talented Western mathematician of the Middle Ages. Fibonacci numbers are simply a series of numbers that when you add the previous two numbers you come up with the next number in the sequence. Here is an example: 1, 2, 3, 5, 8, 13, 21, 34, 55, and 89. The relationship between these numbers is what gives us the common Fibonacci retracement patterns that we use in technical analysis. The ratios that we use in technical analysis are derived from the Fibonacci sequence.
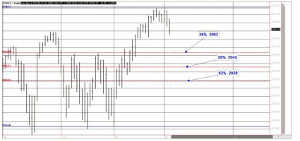
The Fibonacci sequence can be applied to all living things. When applied to financial chart analysis, the most popular Fibonacci retracements are 61.8% and 38.2%. Note that 38.2% is often rounded to 38% and 61.8 is rounded to 62%. After prices advance, we can apply Fibonacci ratios to define retracement areas and forecast the extent of a pullback or correction. Fibonacci retracements can also be applied after a decline to predict the length of a countertrend bounce.
Daily E-mini S&P 500

Chart provided by APEX
Click to Enlarge
These retracements can be combined with other technical indicators and price patterns to create an overall trading strategy.
By Blake Robben of Archer Financial Services


