Though there are signs that the market is losing upside momentum, there are no clear sell signals yet, so buyers should be very selective and focus on risk, counsels MoneyShow's Tom Aspray.
Stocks continued higher last week as sector rotation has kept the major averages moving higher. The regional banks led in the early stages of the rally but peaked on July 8 before correcting for six-seven days. They turned higher late last week and may be ready to lead the market higher again
The S&P 500's relentless 7% rally from the late June lows has caused some investors and analysts to chase prices higher. In last Monday's daily column, I wondered Should You Be Buying Now? I looked at where a reasonable stop could be placed, and while the SPY through last Thursday had gained another 0.7% for the week, in my opinion it still does not justify a 7.8% risk.
I believe that paying attention to the risk of any investment before you make is the most important variable in your investing or trading success. This is true no matter whether you are using technical or fundamental analysis to make your decisions.
- For additional reading, see - 5 Rules for Success in 2013
It is important to be able to separate stock market risk and the risk of any one position. In the June 28 column, I noted that "the number of NYSE stocks above their 50-day MAs dropped below 28 last week and has now risen to 40." At 40, it was still well below the mean of 62, so was oversold. The current reading is just over 71 and close to the May high at 77. It clearly is no longer oversold.
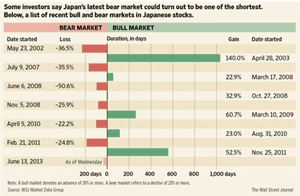
The perpetuation of some common investing concepts can also sometimes lead investors astray. Identifying bear markets by a 20% decline can often have them selling when they should be buying. A recent example may be the four-week, 20% decline in the Nikkei 225 that ended on June 14.The sentiment in June was quite negative, but Nikkei 225 is now up over 19% from those lows, which were at levels where the technical evidence indicated good support. The table above highlights several other examples when relatively brief declines in the Nikkei 225 were followed by powerful, longer-lasting rallies.
In 2011, the Spyder Trust (SPY) declined 20% from May through October 2011, which turned the sentiment very bearish. Since the A/D line turned positive in the October 2011 lows, the SPY has gained 54%.
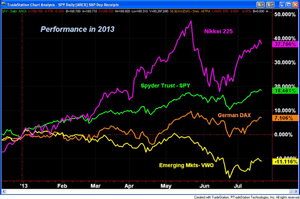
A look at the global stock markets confirms that the Japanese market has clearly been the leader. The Nikkei 225 is up well over 37% so far this year, which is double the 18% gain by the Spyder Trust (SPY). The German Dax is up just 6.8%, so far in 2013, but when measured from the June 2012 lows is still leading the SPY by 8%. It is no surprise that the emerging markets, as represented by the Vanguard FTSE Emerging Markets ETF (VWO), is the weakest as it is down over 11%.
On a day-to-day basis, the earnings reports are determining the intra-day swings. Last Thursday was a good example as weak earnings from Google, Inc. (GOOG) and Microsoft Corp. (MSFT) dropped their stocks over 5% in after-hours trading. In Friday's trading, MSFT was down over 11%
In contrast, Chipotle Mexican Grill (CMG) and UnitedHealth Care Group (UNH) were both up 6% after hours in reaction to better-than-expected results. The consensus is for a mediocre earnings season with most investors betting on and investing based on strong results later in the year.
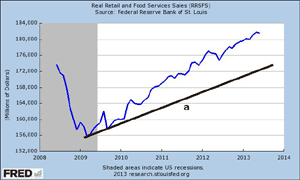
The data on the economy was a bit weaker than analysts expected as retail sales disappointed, gaining 0.4% when most were expecting a 0.8% gain. The chart of retail sales shows that it is in a strong uptrend, line a. One should also note that they bottomed out well after the recession was technically over.
The data on the housing sector was mixed with the housing market Index hitting its highest level since early 2006 while the Housing Starts dropped 9.9%. The homebuilding stocks topped in early May, and there are signs that their correction is close to being over.
On Monday we get the latest data on Existing Home Sales with New Home Sales on Wednesday. Also out on Wednesday is the flash report on the Purchasing Managers Index. In addition to the jobless claims, Thursday, we also get the Durable Goods, followed on Friday by Consumer Sentiment.
NEXT PAGE: What to Watch
|pagebreak|What to Watch
Despite the further new all-time highs in the major averages last week, those who bought last Monday's opening still have an uncomfortable level of risk in my opinion. The risk analysis strongly suggests that you will have a better opportunity to buy one of the market-tracking ETFs later this summer.
This does not mean one should avoid the market altogether as there are quite a few stocks that either topped out early in the rally or are still in the process of bottoming. This includes the homebuilders, which have drifted lower after their strong surge on July 11.
I liked the action in some of the energy stocks last week and new positions were established. They still need a strong up day to complete the bottoming process. I am also watching the tech sector despite the disappointing earnings from some of the tech giants last week.
Once we do get a pullback in the overall market, we may get further clues as to which sectors are poised to lead the market higher as we head into year end. The improvement in the energy sector (see below) could be sending an early signal. A correction would also help to dampen the recent bullishness especially if we get one or two sharp down days.
Not much change last week in the individual investor sentiment as the number of bulls in the AAII survey declined slightly to 47.7% from 48.9% the previous week. The financial newsletter writers did become more bullish as the number of bulls jumped to 52.1%, up from 46.9% the prior week and 41.7% three weeks ago. The number of bears has dropped back below 20% with the latest reading at 19.8%.
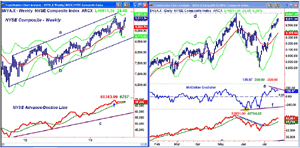
This week, I would like to take a look at both the weekly and daily analysis of the NYSE Composite and its A/D line. On the weekly chart (on the left), it is evident that the starc- band was tested at the June lows before prices reversed to the upside.
The May high at 9695 is the next upside target with the starc+ band at 9797. The first real support is in the 9400 area with the rising 20-week EMA at 9201. The quarterly pivot is at 9251.
The weekly NYSE Advance/Decline line did confirm the new highs in May (see arrow), which is bullish for the intermediate-term trend. It has traded in a narrow range over the past two weeks and is just barely above its WMA. It is well above the late 2012 highs and the uptrend, line c.
The daily chart of the NYSE Composite shows that it came close to its daily starc+ band over a week ago. The daily starc+ band is now at 9688. There is minor support now at 9443-9462 with the 20 day EMA at 9367.
The McClellan oscillator formed multiple positive divergences at the recent lows, line f, that was confirmed by the move through the zero line. The oscillator now shows a slight negative divergence, line e, which makes the market vulnerable to a correction. The daily downtrend in the A/D line was broken in late June when its WMA was also overcome.
NEXT PAGE: Stocks
|pagebreak|S&P 500
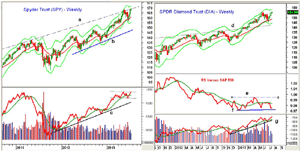
After the strong surge on July 11, the Spyder Trust (SPY) has continued to grind higher but the ranges have clearly narrowed. The weekly chart shows that the long-term trend line resistance that goes back to the 2012 highs, line a, is again being tested. This week the starc+ band is at $171.74.
There is first good support in the $166 area, which corresponds to the mid-June highs. There is additional support at $163 with the quarterly pivot at $161.01. The rising 20-week EMA is at $160.50.
The weekly on-balance volume (OBV) is just testing the recent highs and is still locked in its trading range (dashed lines). The OBV is above its flat WMA. The daily OBV (not shown) is above its highs but has not confirmed the new highs.
The daily S&P 500 A/D line (not shown) has moved well above the May highs and confirmed the price action. It is well above its rising WMA.
Dow Industrials
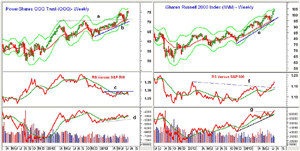
The SPDR Diamond Trust (DIA) has moved higher for the past four weeks with the weekly starc+ band at $157.89. DIA looks ready to form a doji this week. This makes the low at $153.93 the level to watch on this week's close.
The weekly relative performance is still in a broad trading range, lines e and f, that goes back to late last year. The RS line needs to move through the resistance at line e, to signal it is leading the S&P 500 higher.
The weekly OBV for DIA has made new highs confirming the price highs. The OBV has good support its WMA and the uptrend, line g. The daily OBV (not shown) is also positive so the multiple time frame OBV analysis still points higher.
The daily Dow Industrials A/D line (not shown) has moved well above the May-June trading range, which confirms the price action. There is initial support now at $152-$153 with the 20-day EMA at 4152.59. The quarterly pivot is at $149.25 with the 20-week EMA at $148.44.
Nasdaq-100
The PowerShares QQQ Trust (QQQ) gapped lower last Friday and closed the week near the lows. The negative tech earnings really hit it hard. There is next support at $73.70 and then in the $72-$72.50 area. The quarterly pivot is at $71.03 along with the 20-week EMA and the September highs, line a.
The relative performance turned down this week as it has failed to move through the resistance at line c. A move above this level is needed to signal that the Nasdaq 100 is leading the S&P 500.The weekly OBV has turned lower but is still above its WMA.
The Nasdaq-100 A/D line (not shown) did confirm the recent highs but flattened out with last Friday's close. There is first resistance for QQQ at $75-$75.54 with the weekly starc+ band at $76.77.
Russell 2000
The iShares Russell 2000 Index (IWM) again led the market higher as it closed near the week's highs. The weekly starc+ band at $105.61 is not far below Friday's close with the quarterly R2 resistance at $106.65.
The relative performance staged a major breakout in early July, line f, confirming that the small caps were the market-leading sector. The weekly OBV moved through its resistance at line g, which confirmed the price action. The OBV now has good support at its uptrend.
The Russell 2000 A/D line (not shown) is still acting strong as it has moved well above the May-June highs.
There is initial support now at $101-$102 and then in the $100 area. The rising 20-week EMA is at $96.44 with the quarterly pivot at $95.50.
NEXT PAGE: Sector Focus, Commodities, and Tom's Outlook
|pagebreak|Sector Focus
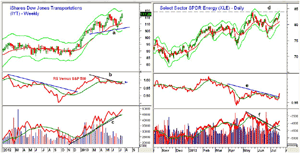
The iShares Dow Jones Transportation (IYT) again was one of the best performers, gaining over 2.3% for the week. The May highs at $117.30 have been surpassed with the starc+ band now at $120.17.
The relative performance has broken its short-term downtrend, line b, and moved above its WMA, signaling that it is now a market leading sector.
The OBV has confirmed the new highs after testing its WMA in June. There is initial support now at $114-$115.40 with the quarterly pivot at $110.98.
The Select Sector SPDR Energy (XLE) did well last week gaining just over 2%. It is getting close to its all-time high at $83.95 as it was strong Friday.
The daily relative performance has broken its daily downtrend, line e, suggesting it is ready to become a market-leading sector as I suggested in a recent trading lesson. The OBV moved through its downtrend and is rising nicely as it is well above its WMA.
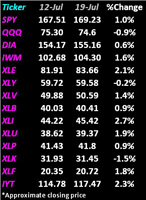
The weekly performance table below looks at the performance from July 12 through July 19.
The Select Sector SPDR Industrials (XLI) was the best performer, up 2.7% just before the close. The Select Sector SPDR Utilities (XLU) also did well, up 1.9%, with a similar gain in the Select Sector SPDR Financial (XLF).
The Select Sector SPDR Consumer Discretionary (XLY) and the Select Sector SPDR Technology (XLK), along with the PowerShares QQQ Trust (QQQ), were all lower for the week.
Crude Oil
Crude oil had another good week gaining almost $2. The volume has been strong over the past few weeks and is confirming the price action. Crude oil looks ready to challenge the yearly resistance at $110.55.
Precious Metals
The rebound in gold futures and in the Spyder Gold Trust (GLD) may be running out of steam. There has been little improvement in the daily technical studies as they confirmed the recent lows. This is despite the fact that we are entering a strong seasonal period.
The Week Ahead
The stock market closed mixed on Friday with the Dow Industrials and Nasdaq 100 lower while the S&P 500 was up slightly. Though there are some signs that the market is losing upside momentum, there are no clear sell signals yet.
The Dow Industrials and S&P 500 made new all-time highs again last week, though the market was unkind to those companies that missed earnings. I still think that any new buying should be very selective with close attention paid to risk until we see a market correction. A drop back to their 20-day EMAs should provide a good entry point.
As I noted in the Charts in Play Portfolio update, I am letting some of my long-term winners run as I have already taken some profits in these stocks. I will be watching new additions closely, and if I see technical deterioration, I may close them out.
For those who have weathered the storm in the bond market, rates came down last week, and I expect they will decline further in the next few weeks. I would use this opportunity to shorten the maturity and/or reduce your exposure to the bond market.
Keep an eye on my Twitter feed as I will often Tweet my new recommendations before the opening.
- Don't forget to read Tom's latest Trading Lesson, Red-Hot Summer Sectors.

