The growing focus on the election and the fiscal cliff have turned sentiment on the stock market more negative, but MoneyShow’s Tom Aspray says the market’s internal health is sending him a much different message.
The Dow Industrials was dragged down Wednesday by the 4.9% drop in IBM’s (IBM) stock. But once again the market was internally strong, as 2,071 stocks advanced but only 933 declined. Bullish overnight news on China’s economy has boosted the emerging markets, but US stock futures remain lower in early trading.
Even though the S&P 500 is only 1% below the September highs, sentiment on the stock market has turned more negative. Whether it is a panel of top CEOs, or regular Joes tracked by the American Association of Individual Investors (AAII), very few are looking for stocks to move higher.
This week’s survey from the AAII shows that only 28.6% are now bullish, while 44.6% are bearish. As the market has climbed, the individual investor has become more negative. On August 23, only 26% were bearish according to AAII.
Even the financial newsletter writers have started to change their tune: only 42.6% are bullish now, down from 54.2% in September.
In the coming weeks these numbers are likely to change, as the technical evidence reveals that the market is actually gaining strength. Let’s look at the evidence.
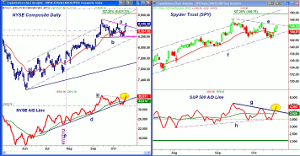
Chart Analysis: The daily chart of the NYSE Composite shows that the flag or triangle formation (lines a and b) was completed with Wednesday’s close.
- Unlike some of the other averages, the NYSE Composite held well above the August highs on the recent correction.
- The 127.2% Fibonacci retracement target is at 8,631, which also coincides nicely with the upper parallel trading channel.
- This upside target is just over 2% above Wednesday’s close
- The price action has been confirmed by the NYSE Advance/Decline line, as it has moved above its previous high and the resistance (line c).
- The A/D line did make new highs in September, confirming the price action, and it is once again close to making new highs.
- There is initial support at 8,304. A much stronger level follows at 8,200.
The Spyder Trust (SPY) closed just below its trend line resistance (line e) at $146.60. Since the September highs, SPY appears to have traced out a typical continuation pattern, which often set up excellent trading opportunities.
- On a close above the early October high at $147.16, the minimum upside target is $149.78, the 127.2% Fibonacci retracement target.
- There are additional upside targets in the $152 to $153 area.
- The S&P 500 A/D line has been lagging the price action over the past few months, but has just moved through its downtrend (line g).
- It is positive that the previous highs have also been exceeded.
- The good support for the A/D line was tested last week, as the daily price uptrend (line f) was tested.
- There is minor support now at $145.30 to $145.60, with stronger levels at $144.40 to $144.80.
NEXT: Tom's Key Levels for 2 More Major ETFs
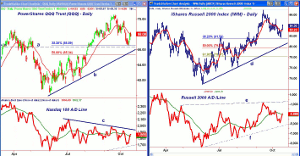
|pagebreak|The Powershares QQQ Trust (QQQ) dropped down to its 38.2% Fibonacci retracement support last week, which appears to be holding.
- The daily uptrend is at $65.80 (line b) with the more important 50% support level at $65.34.
- The Nasdaq-100 A/D line continues to act weak, as it has just moved back above its WMA.
- The A/D line shows lower highs (line c), and needs to move above the September highs to improve the technical outlook.
- The rebound has tested the declining 20-day EMA, with further resistance at $69 to $69.50.
- A daily close above $69.80 will complete the correction.
The iShares Russell 2000 Index (IWM) also corrected to the 38.2% support level on Monday before rallying back to the $84 level. The chart shows a typical a-b-c corrective pattern.
- A close above the early October high at $85.25 will complete the corrective pattern.
- There is further resistance in the $86 to $87 area.
- The Russell 2000 A/D line has moved back above its WMA and has formed higher highs since the June lows (line f).
- A move in the A/D line above the resistance (line e) will be a very positive sign.
- There is short-term support now at $83 to $83.30, and then stronger levels in the $82.40 to $82.60 area.
What it Means: The bullish readings from the market internals like the NYSE A/D line favor an eventual move well above the September highs before the election.
The bond market has continued to weaken, and a move in the yield of the ten-year Treasury Note above 1.9% would be a sign that rates are bottoming.
Health care and biotechnology, two of “October's Top Seasonal Sectors,” continue to do well.
New longs are recommended in three of the widely followed ETFs on a slight pullback. A full test of the recent lows is possible, but does not look likely.
How to Profit: For the Spyder Trust (SPY), go 50% long at $145.69 and 50% long at $145.12, with a stop at $141.89 (risk of approx. 2.4%). Cancel the order on a move above $147.25.
For the iShares Russell 2000 Index (IWM), go 50% long at $83.46 and 50% long at $82.84, with a stop at $80.88 (risk of approx. 2.7%). Cancel the order on a move above $84.65.
Another interesting way to participate in the expected stock market rally is the Vanguard Emerging Markets Viper (VWO), which should outperform the SPY and currently yields 3.4%.
For the Vanguard Emerging Markets Viper (VWO), go 50% long at $42.36 and 50% long at $42.08, with a stop at $40.74 (risk of approx. 3.5%). Cancel the order if $42.93 is hit first.


