Wednesday’s early drop in crude oil prices took them below key support and warned that stocks could soon follow. Moneyshow’s Tom Aspray examines the stock market’s current technical outlook to explain what type of correction we should expect.
The stock market underwent its sharpest decline since December 28 as the S&P 500 lost over 1.5% as did the Nasdaq Composite. The selling was much heavier in some of the individual sectors as the homebuilders, semiconductors, and oil services were considerably weaker.
The day started off poorly as the 8:30 am report on housing starts showed an 8.5% decline with over a 50% drop in the Midwest from the prior month. The release of the FOMC minutes in the afternoon was the main reason to sell. On Thursday, a weak market will have to deal with Existing Home Sales, Leading Indicators, and then two widely watched reports on manufacturing.
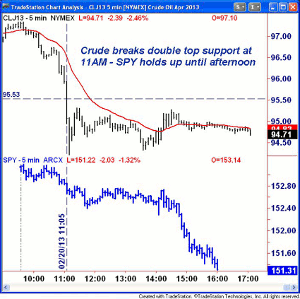
The crude oil market gave an early warning of the stock market’s slide. The 5-minute chart of the crude oil futures shows that the key support at $95.53 was broken just after 11am. This completed crude’s double top formation that I warned about last week. The chart shows that the Spyder Trust (SPY) traded in a $152.40-$152.75 area for several hours before plunging after the FOMC minutes were released.
The stock index futures are lower again early Thursday but are still well above the widely watched support in the 1490-1490 area, so what’s next?
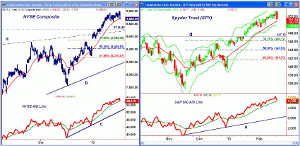
Chart Analysis: The daily chart of the NYSE Composite shows Wednesday’s close below the 20-day EMA.
- There is next chart support now at 8840-50 with more important in the 8719 area and the early 2011 highs, which is 1.8% below current levels.
- Calculated from this week’s highs the 38.2% Fibonacci retracement support is at 8548 along with the weekly starc- band (not shown).
- The NYSE Advance/Decline made new highs this week before turning lower.
- The A/D line is now testing its WMA with major support at the uptrend, line c.
- There is near-term resistance now in the 8950-9000 area.
The Spyder Trust (SPY) closed below the prior six day lows on Wednesday but is still above the 20-day EMA at $150.76.
- The daily starc- band is now at $149.82 with further chart support at $149.43.
- Using Tuesday’s high the 38.2% Fibonacci support level is at $146.12 with the major 50% at $143.91.
- The S&P 500 A/D line made new highs this week before turning lower.
- The A/D line is still above its WMA and in a clear uptrend.
- There is initial resistance now at $151.40 and then at $153.19-$153.28.
- The multiple time frame OBV analysis shows that the daily OBV (not shown) is still above its uptrend but below its WMA while the hourly analysis is negative.
NEXT PAGE: How Sharp Will the Correction Be?
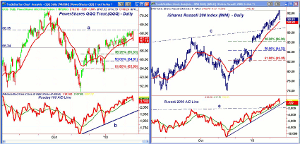
|pagebreak|The rally in the Powershares QQQ Trust (QQQ) failed to overcome the resistance at $68.35, line a, before the 1.5% drop Wednesday.
- Wednesday’s close was well below the 20-day EMA with next good chart support now at $66.34, which is 1.2% below current levels.
- The rally in the QQQ since the start of the year has been much weaker with the 38.2% Fibonacci support now at $65.63. The quarterly pivot is at $66.10.
- The more important 50% support is at $64.81, which is 3.5% below Wednesday’s close.
- The Nasdaq 100 A/D line has dropped well below its WMA and is already close to the December highs.
- The volume Wednesday was the heaviest of the past six days, which is a sign of weakness.
- Initial resistance is now at $67.70-$68.
The iShares Russell 2000 Index (IWM) made a slight new rally high at $92.68 before reversing sharply to close at $90.83, which was down 1.8% for the day.
- The rising 20-day EMA is now at $90.28 with longer-term trend line support, line c, now at $88.71.
- There is additional support at $86.96, which was last September’s high.
- The 38.2% Fibonacci retracement support is at $86.30 with the quarterly pivot at $83.28.
- The daily Russell 2000 A/D line did make a new high this week before turning lower.
- The A/D line is not far above its WMA or its uptrend, which are likely to be broken over the near term.
- There is resistance now at $91.78 to $92.68.
What It Means: The stock market has a seasonal tendency to decline this month, which was the February surprise I discussed last month, and typically, they last several weeks.
The daily technical studies are still mostly positive and the current technical outlook suggests two likely correction scenarios.
The first and most likely is that we will see a 3-5 day decline in the S&P 500 to the 1480-1485 level. This would be followed by a sharp rally that should take the major averages back to, and possibly above, the recent highs.
The other likely scenario is that we will see a brief but sharp drop that is followed by a rally that would take the S&P 500 to the 1540-1550 area.
The expected showdown over the sequestration deadline is likely to cause a further increase in volatility and put buying was heavy yesterday. This is wild card as some nervous selling is likely as the deadline is approached but another last-minute deal could be followed by a relief rally.
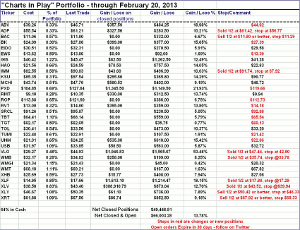
I have been recommending select profit taking for most of the month and have continued to tighten the stops on stocks in the portfolio. It is updated today.
How to Profit: There are no strong signs yet that the inverse ETFS have completed sustainable bottom formations, so I have no new recommendation.
Portfolio Update: Should be long the iShares Russell 2000 Index (IWM) from $82.55 and sold half on the close last Friday at $91.74. Use a stop at $87.92 on the remaining position.
NEXT PAGE: The Charts in Play Portfolio
|pagebreak|


