The impressive stock rally has caused some to chase prices, while others have remained bearish without a well-defined exit strategy. MoneyShow's Tom Aspray looks at the key technical indicators and points out the warning signs investors should watch for before they take action.
The Dow’s tenth higher close in a row has certainly gotten the public’s attention, though most are now watching to see if the S&P 500 will also make a new high today.
The last ten-day winning streak occurred in 1996, ending on November 15. It was followed by a slightly lower close the following day...but the Dow then moved 2.8% higher over the next six days. From that close on November 15, the Dow gained almost 13% in the next three months, peaking in March 1997.
The technical studies, as discussed below, show no signs yet that the rally is over. But in my experience, another 13% on the upside would require a deeper correction than we saw in late February. In 1996, there was a 6% pullback over three weeks before stocks resumed their uptrend.
It certainly is a hard time for those investors or traders who have not participated in this year’s rally, and it makes having a clear plan more important than ever.
It is also important not to make the same mistake as some of the financial-media talking heads. Most willingly share their market views, but do not provide (or are rarely asked about) their exit strategy. That is a mistake that real investors or traders can not afford to make.
The talking heads are rarely held accountable. One frequently quoted analyst commented in early February “I am at my highest net short position,” but gave no exit strategy. That is the type of non-flexible attitude that will bankrupt most individual investors or traders.
Don’t get me wrong—I have had my share of wrong calls over the past 30 years. But I always have a clear level that tells me when I am on the wrong side of the market. Concentrating on the entry level, risk, and stops are three of the key rules I think one needs to follow in order to be successful.
By taking a current look at the market internals, we can identify what signs I am looking for to warn of a deeper correction.
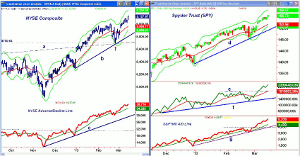
Chart Analysis: The daily chart of the NYSE Composite shows the strong new rally high on Thursday, with the Starc+ band at 9,224, just 0.6% above the close.
- The weekly Starc+ band is at 9,296, with resistance from 2008 at 9,400.
- There is additional resistance at 9,724, with the all-time highs at 10,311.
- The NYSE Advance/Decline made another new high Thursday, and is well above its rising WMA.
- The A/D line did break its WMA on the late February correction, but did not form a new downtrend, which would have signaled a deeper correction. There is longer-term support for the A/D line at line c.
- There is minor support now in the 9,000 to 9,050 area, with further levels around the rising 20-day EMA at 8,969.
- If the NYSE forms a convincing daily top, we will start looking at the key Fibonacci retracement levels.
The Spyder Trust (SPY) broke out of its four-day trading range Thursday. The all-time high is $157.52, and the daily Starc+ band now stands at $158.67.The weekly Starc+ band is at $159.27.
- The on-balance volume (OBV) broke out through its resistance (line e) on March 6 and made further new highs this week.
- The OBV is now well above this support and the rising WMA.
- The S&P 500 Advance/Decline line made convincing new highs on Thursday. It would likely take a week or more before it could form a top.
- There is initial support for the A/D line at its WMA and then the uptrend (line g).
- There is initial support now at $155.40 and then at $152.70.
- Key support is at $148.73, which was the late February low.
NEXT: What Tom Expects in March and April
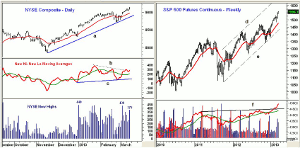
|pagebreak|The daily uptrend on the NYSE Composite is now at 8,868. The NYSE New High and New Low analysis shows some slight divergences, but the momentum is positive short term.
- The five-day WMA of the H-L formed a divergence at the February highs (line b), but this downtrend was broken late last week.
- The five-day WMA is back above the 13-day SMA and turned up yesterday.
- There is important support now at line c, and a violation would be negative.
- There were 375 new highs on the NYSE Thursday, which was below the March 5 high of 430. On January 2, there were 440 stocks that made new highs.
The weekly chart of the S&P 500 futures, based on the continuous contract, continues to look very strong, with the weekly Starc+ band at 1,586.
- The upper boundaries of the long-term trading channel (line d) is now well above 1,600.
- The weekly OBV dropped below its WMA in early November, but moved back above it in late December.
- The break through long-term resistance at the start of February was a bullish signal that the bears should not have ignored.
- The weekly OBV has turned up sharply over the past two weeks, and the daily OBV is also positive. Therefore, the multiple time frame OBV analysis continues to be bullish.
- There is first weekly support in the 1,520 to 1,525 area, and then at 1,508.
What it Means: The daily and weekly analysis of the major averages indicates that stocks can still move higher. The slight divergence in the H-L needs to be watched, but I would expect more severe divergences to be formed before a top is in place.
Typically, March is a choppy month, but we may get an increase in ranges before the end of the month. April is a much better month for stocks, and until there are signs that the A/D lines have started new downtrends, the upside is favored.
How to Profit: No new recommendations. I would not chase any of the market-tracking ETFs at current levels.


