Vadim Pokhlebkin of Elliott Wave International cites recent market action in order to dispel the common idea that stocks and oil are highly correlated.
There is a myth out there that needs to be dispelled. Last Wednesday (March 28), the US stock markets closed lower, and the headlines were there to explain why: falling oil prices.
"Wall Street slid deeper into the red as traders reacted to sinking oil prices and weaker-than-expected data on the US manufacturing sector." (Fox Business, March 28)
The notion that oil and stock prices are linked is everywhere. Usually, it’s a negative link, as in oil falls, and stocks rise. But as we see above, sometimes the "explanation" claims falling oil is "bearish" for stocks.
The truth is simple: the link between stocks and oil does not exist.
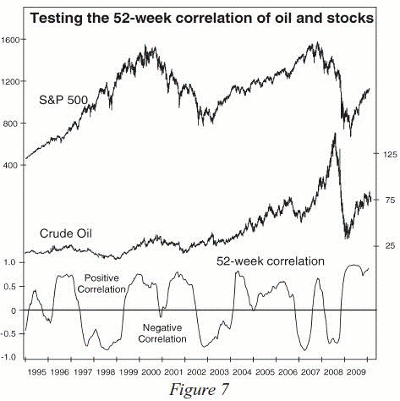
Here’s part of the evidence Robert Prechter presented in his Elliott Wave Theorist:
“It would take weeks to collect all the statements that economists have made to the press to the effect that recently rising oil prices are “a concern”... For many economists, the underlying assumption about causality in such statements stems from the experience of 1973-1974, when stock prices went down as oil prices went up. Figure 7 shows, however, that for the past 15 years there has been no consistent relationship between the trends of oil prices and stock prices. Sometimes it is positive, and sometimes it is negative.”
Prechter goes on to say that, “...In fact, during this period it has been positive for more time than it has been negative! And the quarters during this period when the economy contracted the most occurred during and after the oil price collapse of 2008. Thereafter oil prices doubled as the economy was reviving in 2009. This graph negates all the comments from economists who say that an “oil shock” would hurt the stock market and the economy. It also throws into doubt the very idea that stock prices and oil prices are linked.”
So, if you cannot predict what stocks will do by looking at oil—or vice versa—then how can you forecast those two markets?
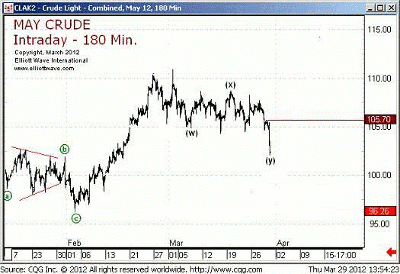
Elliott wave analysis can help. Here is one of the March 29 intraday charts:
NYMEX Crude (Intraday)
Posted: March 29, 2012, 1:54 pm ET
Last Price: $102.35
As you can see, oil prices have been moving sideways in a choppy, overlapping manner. That’s the very definition of an Elliott Wave correction, which you see labeled (w)(x)(y) in the chart above.
By Vadim Pokhlebkin of Elliott Wave International
Learn about other market myths in a free report, Market Myths Exposed.


