With interest rates still at all-time lows, it’s no surprise that M&A activity is near all-time high levels, as MoneyShow’s Tom Aspray takes a technical look at three stocks that could be the next acquisition targets.
Though many traders likely left early for the long Memorial weekend, the bulls did not leave early as they kept prices strong into the close. The market internals, including the up/down volume, were 2 to 1 positive. The weekly and daily NYSE Advance/Decline lines made further new highs last week, reversing the deterioration that was evident early last week.
The markets will be hit by a barrage of fundamental data today with Durable Goods, the S&P Case-Shiller HPI, and Consumer Confidence all scheduled to be released. Investors will also be watching Markit’s PMI Services Index along with the manufacturing data from both the Richmond and Dallas Fed districts.
Over the weekend, Pfizer Inc. (PFE) finally dropped its bid for AstraZeneca (AZN) over the weekend. This has clearly been a year dominated by mergers and acquisitions as globally M&A activity is up well over 40% from a year ago.
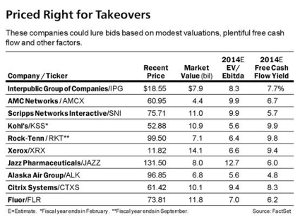
Over the weekend, in a Barron’s article How to Play M&A, they came up with a list of ten stocks that their fundamental analysis suggested were prime takeover targets. A technical review of the monthly and weekly charts of these stocks revealed three that stand out with their positive long-term charts.
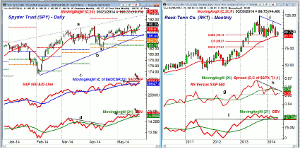
Chart Analysis: The Spyder Trust (SPY) closed at a new all-time high Friday, which likely shocked some of the already vacationing market bears.
- The daily starc+ band at $192.03 is still well above current levels with the weekly at $195.58.
- The upper trend line resistance is at $193.40 with the monthly projected pivot resistance at $194.83.
- The S&P 500 A/D line closed at a new all-time high, confirming the price action.
- The on-balance volume (OBV) was lagging prices in early April but finally broke its downtrend, line d, in the middle of the month.
- The OBV has also made new highs as the resistance at line e, was overcome.
- Even more impressive was the upside reversal in the weekly OBV (see chart), which has now made convincing new highs.
- The rising 20-day EMA is at $188.67 and the monthly pivot at $186.44 has held throughout May.
Rock-Tenn Co. (RKT) is a $7.07 billion container and packaging company that peaked in 2013 at $124.75. It has a current yield of 1.40%.
- RKT had a correction low of $91.47 at the end of 2013 as the 38.2% Fibonacci support at $95.13 was violated.
- The 20-month EMA at $93.70 has held in May with the 50% retracement support at $86.07.
- The weekly chart shows an apparent flag formation, which is one of my favorite chart setups. The downtrend, line f, is at $112.45.
- The early 2014 high at $115.97 coincides with the quarterly projected pivot resistance.
- The monthly starc+ band is at $127.60 with the 127.2% Fibonacci retracement resistance at $135.
- The monthly relative performance is trying to turn up this month as it has reached long-term support at
line g. - Only the daily RS line appears to have completed its bottom formation.
- The monthly OBV staged a major breakout in 2013 and this support (line i) has now been tested.
- It has turned up and the weekly OBV (not shown) is well above its WMA.
- There is minor support now in the $98.40-$98.50 area with further at $97.50.
NEXT PAGE: 2 More Stocks to Watch
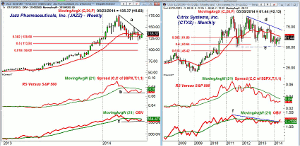
|pagebreak|Jazz Pharmaceuticals, Inc. (JAZZ) is an $8.04 billion specialty biopharmaceutical company that peaked in February at $176.60. It was one of the many stocks hit by the heavy biotech selling.
- The low two weeks ago was $120.38, which was a drop of 31.8% from its high.
- The correction has taken the stock back to a high-probability buy zone between the 38.2% and 50% Fibonacci support from the April 2013 lows.
- JAZZ closed last week above its flat 20-week EMA at $133.87.
- There is next resistance in the $139-$140 area with the quarterly pivot at $146.28.
- The relative performance did confirm the highs early in the year and is now trying to bottom out.
- The weekly RS line is still below its WMA while the daily (not shown) is close to bottoming out.
- The weekly OBV also shows a potential bottom formation, line c, and could close back above its WMA this week.
Citrix Systems, Inc. (CTXS) is a $10.07 billion business software and services company that has been in a broad trading range since it peaked at $88.49 in June 2011.
- Hedge fund Third Point established a position in this stock last quarter.
- The monthly chart appears to reveal a 28-month triangle or flag formation, lines d and e.
- The low in 2011 and early 2014 took prices slightly below the major 50% retracement support at $53.84.
- The rising 20-day EMA is at $60.15 with the quarterly pivot at $57.27.
- The monthly relative performance has been below its WMA since July of 2012.
- The weekly RS line is now back above its WMA.
- The monthly OBV is acting much stronger as it looks ready to close above major resistance (line f) this month.
- The weekly OBV (not shown) is acting stronger than prices as it is well above its rising WMA.
- The declining 20-month EMA is at $63.45 with the quarterly projected pivot resistance at $63.37.
- There is further resistance in the 67 area with the monthly downtrend, line d, in the $71.50 area.
What It Means: I often find that fundamental scans do provide good material for my technical watch list, but as always, the focus should be on the risk of each trade. Many of the ten stocks featured in the article may open higher Tuesday due to the phenomenon known as the Barron’s Boost.
Stocks that they recommend can move higher after they have been featured, but often trade back to the pre-article levels in the following weeks. Therefore, patience is important.
Durable Goods came out strong this morning and the futures are sharply higher in early trading. As I noted last week, “The repeated breakout failures have made most traders skeptical, so a sustainable move to the upside could catch the majority by surprise.”
It may take two consecutive closes in the Spyder Trust (SPY) above $191.50 to convince the market skeptics.
How to Profit: For Rock-Tenn Co. (RKT), go 50% long at $98.39 and 50 % at $97.64, with a stop at $93.59 (risk of approx. 4.5%).
For Jazz Pharmaceuticals, Inc. (JAZZ), go 50% long at $131.08 and 50 % at $127.86, with a stop at $122.77 (risk of approx. 5.2%).
For Citrix Systems, Inc. (CTXS), go 50% long at $59.46 and 50 % at $58.14, with a stop at $56.43 (risk of approx. 4.2%).
Portfolio Update: Should be 100% long the Spyder Trust (SPY) at $185.02. Use a stop at $185.83.
Should be 50% long PowerShares QQQ Trust (QQQ) at $86.88 or better. Use a stop now at $86.47.


