Janet Yellen's comments about biotechnology and social media stocks surprised the markets on Tuesday, so MoneyShow's Tom Aspray takes a technical look at the charts of a biotech ETF and three stocks to determine if they are indeed vulnerable.
The surprisingly strong earnings reports from JPMorgan Chase (JPM) and The Goldman Sachs Group (GS) boosted stocks in early Tuesday trading but then comments from Fed Chair Janet Yellen seemed to cut the rally short. The markets closed mixed.
The financials' stocks were able to close strong, led by a 1.35% gain in the KBW Bank Index but the NYSE market internals were 2-1 negative. As I have noted since last week's Should You Reconsider Buying the Dip?, there are signs of deterioration in the technical studies.
The Euro zone markets are showing nice gains in early trading as the data on China's economy was stronger than expected. The US futures are also sharply higher despite the weak earnings from Bank of America (BAC) reported early Wednesday.
So far, the daily sell signals are confined to the iShares Russell 2000 (IWM) so new market highs are still a possibility for the other ETFs that track the major averages. Nevertheless, the market, in my opinion, still appears to have too much risk at current levels even though the highs in the weekly NYSE Advance/Decline are a positive sign for the major trend.
Janet Yellen's comments Tuesday regarding both the biotechnology and social media stocks surprised the market. A look at the charts of some key biotech stocks suggests that the Fed may be using technical analysis. My analysis of the charts and technical indicators does indicate they are vulnerable. Some show potential double top formations, which suggests that the recent rally may just be a pause in the downtrends that began in March. Let's look at some key charts.
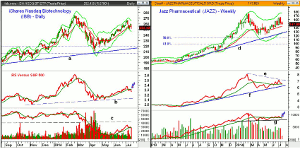
Chart Analysis: The iShares Nasdaq Biotechnology (IBB) peaked at $274.98 before starting a sharp six week slide to a low of $207.16. This was a decline of 24.6%.
- The rebound in IBB appears to have peaked two weeks ago with a high of $266.43 as the daily starc+ band was tested.
- Last week's low was tested again on Tuesday as was the monthly pivot at $250.80.
- The quarterly pivot is at $241.46, which is just below the monthly projected pivot support.
- A drop below this support will suggest that IBB could again decline to the 50-61.8% Fibonacci support that was tested in April.
- The daily relative performance has turned lower after testing its flat WMA.
- The volume was double the average on Tuesday which has pushed the daily OBV below its WMA.
- The weekly OBV (not shown) is still above its gradually rising WMA.
- There is initial resistance now in the $258-$260 area.
Jazz Pharmaceuticals (JAZZ) is an $8.78 billion Irish specialty biopharmaceutical company that reports earnings on August 4. It is up 16.8% YTD leading the S&P 500 and IBB.
- The weekly chart shows a wide range over the past month but it is still holding above the 20-week EMA at $142.63.
- The quarterly pivot is at $141.24 with the long-term uptrend (line d) and starc- band in the $124.40-$125.50 area.
- The weekly relative performance has formed sharply lower highs, line e, and is just barely above its WMA.
- A drop in the RS line below the long-term uptrend, line f, would be more negative.
- The weekly volume was weaker on the recent rally than it was going into the early 2014 highs.
- The OBV formed much lower highs and is currently just below its WMA.
- There is more important OBV support now at line g.
- There is initial resistance now in the $155-$158 area.
NEXT PAGE: Two Biotech Stocks to Watch
|pagebreak|Illumina, Inc. (ILMN) is a $22.05 billion biotechnology company that reports its earnings on July 23.
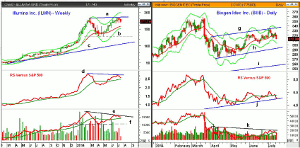
- The weekly chart shows that it made a new high in early July at $184.49.
- This was just slightly above the early March high (line a) of $183.30.
- There is next support in the $166 area with the quarterly pivot at $162.34.
- The flattening 20-week EMA is now at $158.30 with the weekly starc- band at $150.92.
- A drop below the April low of $127.67 (line b) would complete the double top formation.
- The relative performance has formed a bearish divergence at the recent highs, line d.
- The RS line is still above its WMA while the daily (not shown) is not.
- The on-balance volume (OBV) has formed a more pronounced negative divergence, line e.
- The OBV is just barely above its WMA with key support now at line f.
- Looking at the volume histogram, one can see that the volume going into the March was heavier than it was recently.
- There is resistance now in the $180-$183 area.
Biogen Idec, Inc. (BIIB) is a huge $74.01 billion biotechnology company that also reports its earnings on July 23.
- The daily chart shows a broad trading range after the April drop to a low of $272.02.
- The monthly projected pivot resistance at $333.16 and the daily starc+ band were tested last week.
- The monthly projected pivot support is at $304.20 with the quarterly pivot at $303.19.
- There is trend line support now at $292.85 (line h).
- The daily RS line has dropped well below its WMA and is now testing its uptrend, line j.
- The weekly relative performance (not shown) looks ready to close the week below its WMA.
- The volume was heavy during the March decline and has stayed low on the rally.
- The daily OBV has stayed below its resistance, line k, and dropped below its WMA on Tuesday.
- The weekly OBV (not shown) has been below its WMA since March 21.
What it Means: Even if the S&P 500 can make another new rally high, holders of this biotech ETF or these stocks should watch them closely on any market rally. The weak charts, along with the negative OBV and relative performance analysis, make them especially vulnerable if the market turns lower.
If you stuck with these stocks during their spring slide you should consider taking some profits or hedging your positions. As I noted Monday, I prefer the strategy of selling out weak longs when the market is moving higher.


