
The recent toppy action in a number of stocks favors less exposure to the stock market, so MoneyShow’s Tom Aspray takes a technical look at four stocks that suggest tightening of stops and cancelling of open buy orders.
The rally late Friday in the US market has been followed by gains in the overseas markets as we head into a heavy week of economic data. The US futures are also showing nice gains in early trading.
A higher close Monday will set the stage for the S&P 500 and Nasdaq 100 to make further new rally highs. Though last week’s action is being discounted by many, Friday’s analysis did reveal signs of deterioration. This raises the potential for further bearish divergences consistent with the formation of a short-term top.
This does not change intermediate-term bullish signs from the NYSE A/D line and the Long-Term Volume Analysis that show no signs of a major bull market top. The buy the dip strategy seems to be widely accepted, not only for equities, but also for some of the Euro bonds that were hit hard last week.
Though the individual investor—according to AAII—is not overly bullish, the same cannot be said of the financial newsletter writers. The recent data from Investor’s Intelligence indicated that over 60% are bullish with just over 15% bearish.
This, combined with the toppy action in the number of S&P 500 stocks above their 50-day MA (see chart), favors reducing one’s exposure to the stock market even though a daily top has not been confirmed. Taking profits and raising stops on those positions that are acting weaker than the S&P 500 will protect your portfolio and give you plenty of cash to invest at the next good buying opportunity.
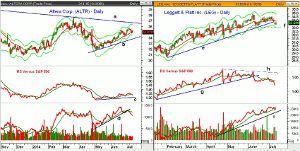
Click to Enlarge
Chart Analysis: Altera Corp. (ALTR) pulled back to its rising 20-day EMA last week but is still holding well above the uptrend, line a. They report earnings on July 24.
- ALTR is up over 10% from the early May lows but is still well below the March-April highs.
- A move above the recent high at $35.75 could signal a move to the monthly projected pivot resistance at $36.93.
- This corresponds to the long-term downtrend which connects the 2013 and 2014 highs.
- The relative performance on the rally has not been impressive as it is well below the highs from early in the year.
- A decline in the RS line, below support at line c, would be negative.
- The weekly RS line (not shown) has failed to move above its WMA on the rally.
- The daily OBV failed to confirm the recent highs and has broken its uptrend, line d.
- The OBV is now well below its declining WMA.
- The monthly pivot is at $34.23 with the last swing low at $34.10.
Leggett & Platt (LEG) gapped below its uptrend, line e, last week and closed just above the monthly pivot support at $33.45. They also report earnings next week on July 24.
- The close last week at $33.60 was just below the doji low at $33.61 so a LCD sell signal was triggered.
- LEG is not far above its daily starc- band and support in the $33 area, line f.
- The quarterly pivot is also being tested with the quarterly support and 38.2% retracement level at $32.20.
- The relative performance broke its uptrend, line g, on June 10.
- The RS line is in a well established downtrend and did form a divergence at the recent highs, line h.
- The OBV did confirm the highs and is holding slightly above its WMA.
- A drop below the OBV uptrend, line i, would be more negative.
- There is initial resistance now at $33.88 and the declining 20-day EMA with further at $34.25.
NEXT PAGE: 2 More Stocks to Watch
|pagebreak|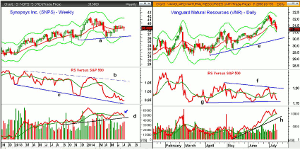
Click to Enlarge
The weekly chart of Synopsys, Inc. (SNPS) shows that it has moved sideways for the past seven weeks even though the market has been strong.
- The quarterly pivot at $38.12 was tested last week with the monthly projected pivot support at $37.80.
- There is major support (line a) and the weekly starc- band at $36.40.
- The 20-day EMA is at $38.82 with weekly chart resistance at $39.50.
- The relative performance has continued to make lower lows as it has stayed well below its declining WMA.
- The daily RS line (not shown) is also below its WMA.
- The weekly OBV dropped below its WMA last week (see arrow).
- A drop in the OBV below more important support at line d, would be negative.
- The daily OBV (not shown) is also below its WMA.
Vanguard Natural Resources (VNR) was a recommendation from the middle of June after it closed at $31.15.
- VNR hit a high of $32.34 before the recent correction as it closed just above the quarterly pivot $31.09.
- The daily starc- band was tested on Friday with the 20-week EMA at $30.59.
- The daily uptrend, line e, is just a bit lower.
- While VNR made significantly higher highs, the relative performance has formed lower highs (line f).
- A drop in the RS line below the support at line g, would be more negative.
- The daily OBV is testing its WMA but did make new highs last week.
- The OBV has more important support at the uptrend, line h.
- The monthly pivot and first resistance is at $31.60 and then at $31.92.
What it Means: In last week’s review of the big tech stocks, some showed signs that they were no longer leading the market higher. Deterioration in the relative performance analysis often means the stock will decline more sharply when the overall market turns lower. Therefore, I am reducing the size of the positions in Altera Corp. (ALTR), Leggett & Platt (LEG), and Synopsys Inc. (SNPS) as well as tightening stops.
For Vanguard Natural Resources (VNR), as well as several others (see Portfolio page), I would cancel the open buy orders. Watch my Twitter feed for intra-day updates.
For the large-cap and sector ETFs, I will continue to use wider stops as I discussed in Pick Your Portfolio Strategy.
How to Profit: No new buy recommendations.
NEXT PAGE: The Charts in Play Portfolio
|pagebreak|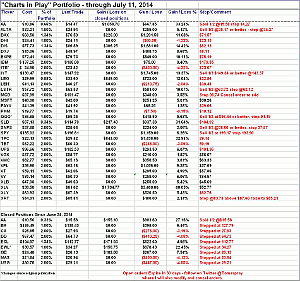
Click to Enlarge


