The extensive analysis of the financial media failed to mention the market's technical deterioration, so MoneyShow's Tom Aspray investigates the charts of two widely watched industry group ETFs that were hit by selling to reveal what could lay ahead for them.
In the extensive post-mortem for Thursday's market plunge, global growth, Gaza, corporate earnings, higher rates, and even the very weak Chicago Purchasing Managers Index bore the majority of the blame.
In the financial media and the morning papers, their extensive analysis fails to mention the market's technical deterioration that has been evident for the past several weeks. Most are still talking about some of the great earnings from the social media stocks. Little attention was paid to stocks like Exxon Mobil Corp (XOM) that reported strong profits but still closed down 4%.
In the middle of May, there were some positive signs like the new high in the Nasdaq 100 A/D line that preceded an upside breakout and a push to new all time highs in most of the major averages. This forced many on the short side to scramble to cover their short positions. The positive readings started to deteriorate in early July and the warning signals persisted as the month progressed.
- July 24 - The Week Ahead: Should You Reconsider Buying the Dip?
- July 24 - Let the Late Buyers Take the Risk
- July 24 - Half Empty or Half Full?
- July 30 - What Will Tip the Scales?
The market's inability to hold Wednesday's earning gains and the weak market internals early Wednesday afternoon shifted the weight of the evidence to the sell side.
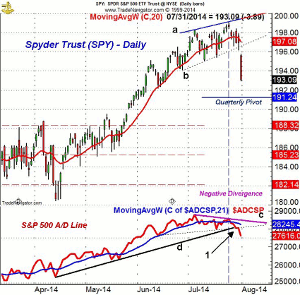
Since the NYSE Composite did not make new highs in late July, the NYSE Advance/Decline Line did not form any negative divergences. The A/D line did break its uptrend on July 17 which was negative. The S&P A/D line did form a bearish divergence (line c) as the Spyder Trust (SPY) made its high on July 24. The A/D line subsequently dropped below its WMA and violated its uptrend, line d, on Tuesday (point 1).
The sharp drop Thursday turns the focus on SPY's quarterly pivot at $191.24. The 38.2% Fibonacci support from the early February lows is at $188.32, which is a potential downside target. The good news is that the almost 10-to-1 negative A/D ratio on Thursday makes a strong snap back rally likely by the middle of next week.
Even two of the top performing industry group ETFs have also been hit by selling, but what lies ahead for these two widely watched ETFs?
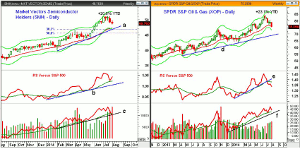
Chart Analysis: The Market Vectors Semiconductor ETF (SMH) hit a high of $51.17 on July 24 and, at that time, was up 20.6% for the year.
- With Thursday's close, SMH is now down 4.7% from its high.
- The quarterly pivot is at $47.58 with additional support in the $46.60-$47.25 area.
- This includes the 38.2% support along with the uptrend (line a) and the weekly starc- band.
- There is even stronger support in the $45.50 area and the 50% support level.
- The relative performance did make a new high as SMH was testing its weekly starc+ band.
- The RS line has turned up from its WMA and is well above the support at line b.
- The weekly OBV did confirm the recent highs but has now dropped below its support at line c.
- The daily indicators (not shown) are firmly in the sell mode.
- Initial resistance at $49.71 and the declining 20-day EMA.
The SPDR Oil & Gas ETF (XOP) was up over 23% just six weeks ago but is now approaching the weekly starc- band at $72.95.
- XOP has corrected 10.4% from its high at $84.04.
- The 38.2% Fibonacci support at $76.18 was not broken, with the 50% support at $73.72.
- This corresponds closely to the quarterly projected pivot support at $45.60.
- The longer-term weekly uptrend, line d, is now in the $69 area.
- The relative performance broke its uptrend, line e, on Friday, July 11 after peaking with prices.
- Though volume is already heavier this week, the weekly OBV is still well above its rising WMA.
- The OBV has further support at line f.
- There is initial resistance at $76.90 with the quarterly pivot at $78.97.
What it Means: The completion of the daily top formation makes a further and deeper correction extremely likely over the next few weeks. This is likely to create a very low risk buying opportunity down the road but would wait for clear signs that the market has bottomed.
The analysis of SMH and XOP currently suggests that this is a correction within an uptrend but there are no signs yet that it is time to buy.
The expected sharp rebound next week will give investors and traders an opportunity to raise cash for when the market bottoms.
How to Profit: No new recommendation.
Portfolio Update: As I Tweeted Wednesday, traders should be long the ProShares Short Dow30 (DOG) at $25.14 or better with a stop at $24.29.
For the ProShares UltraShort 20+ Year (TBT) should be 50% long at $59.58 as the second buy at $59.02 was just missed. Cancel the order to add and use a stop at $57.37.
For the ProShares Ultrashort 7-10 Year Treasury (PST) should be 50% long at $27.06 or better as the low was $26.99. Cancel the order to add to the position and keep the stop at $26.37.


