Many indicators suggest that the stock market may move higher as we head into the second half of the year, so MoneyShow's Tom Aspray takes to the charts to see if traders and investors should look to buy these ETFs in two of the leading sectors.
The stock market recorded impressive gains last week despite the concerns over Janet Yellen's Jackson Hole comments that failed to materialize. The Dow led the S&P higher with a 2.0% gain versus 1.7% for the S&P 500. The mid-cap S&P 400 did even better as it was up 2.1%. The stock index futures are showing nice gains early Monday.
The market internals were also strong with 2318 stocks advancing with just 914 declining. As I reviewed in A September Buying Opportunity?, the daily A/D lines for the NYSE Composite, S&P 500, and Nasdaq 100 all made new highs last week. Once the final numbers were in, the weekly A/D lines for the S&P 500 and Nasdaq 100 also made new highs while the NYSE Composite failed by a small margin.
This indicates that stocks are going to move higher into the end of the year and picking the right sectors will be important as the stocks in those sectors should be some of the top performers. Two key sectors, consumer discretionary and health care, have been leading the S&P 500 since the early August lows.
A look at the weekly technical studies indicates these trends can continue and there are two other ETFs that are not currently part of the Charts in Play portfolio that one should look to buy on a pullback.
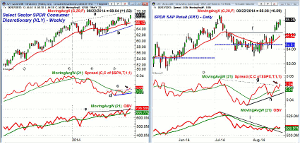
Chart Analysis: The Select SPDR Consumer Discretionary (XLY) has led the S&P 500 by 1% from the August lows. The weekly chart shows the new closing high as the daily starc+ band is being tested.
- The weekly starc+ band is just above $70 as is the weekly resistance (line a).
- The quarterly pivot resistance is just a bit higher at $70.55.
- There is initial support at $67.14 and the rising 20-day EMA.
- The quarterly pivot at $65.14 held at the August lows.
- The weekly relative performance has not completed its bottom formation (lines c and d) as resistance has been overcome.
- The daily RS line (not shown) has surpassed the early July high, which is also positive.
- The weekly OBV has confirmed the new highs by also overcoming its resistance at line e.
- The OBV did drop briefly below its WMA on the recent correction.
The SPDR S&P Retail (XRT) is up just over 6% from the August lows as some of the retail stocks have accelerated to the upside. It is only up 0.41% YTD but that may be ready to change.
- XRT has 101 holdings with 11.4% in the top the holdings. Its expense ratio is 0.35%, considerably higher then the 0.16% that XLY charges.
- The daily chart shows that XRT is still below the early July high of $88.73.
- The weekly starc+ band is at $90.20 with the quarterly projected pivot resistance at $91.73.
- The daily relative performance formed sharply higher lows in early August.
- The downtrend, line g, was broken on Friday.
- The daily on-balance volume (OBV) is now barely above its WMA but the weekly is not.
- There is daily chart support, line f, at $86.10 with the rising 20-day EMA now at $85.84.
- The daily starc- band is at $84.58 which is very close to the quarterly pivot at $84.61.
NEXT PAGE: Two More Healthcare ETFs to Watch
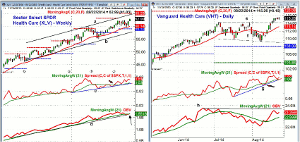
|pagebreak|Select Sector SPDR Health Care (XLV) has outperformed the S&P 500 by 1% in just the past ten days. This sector staged a major upside breakout in 2012 and was up 41.4% in 2013.
- The weekly chart shows a well-defined trading channel, lines a and b.
- The upper boundary is now close to the quarterly pivot resistance at $65.28.
- Three weeks ago, the 20-week EMA was tested and it is now at $60.14.
- XLV did hold well above the quarterly pivot at $59.12.
- The relative performance moved back above its WMA in the middle of June but is still barely below the early 2014 high.
- The weekly OBV moved back above its WMA last week, which generated an AOT buy signal.
- The daily OBV is also positive but the daily chart shows that two dojis were formed at the end of last week so a pullback is more likely.
- The rising 20-day EMA and short-term support are now at $61.81.
The Vanguard Health Care (VHT) has an expense ratio of 0.14% and has a total of 308 stocks in contrast to just 34 in XLV. Both have a relatively high concentration in the top ten holds with 54.7% in XLV and 45.4% in VHT.
- VHT is up 14.1% YTD which is considerably better than the 8.85% gain of the SPY.
- The daily chart shows the completion of the flag formation, lines e and f.
- The measured targets from the formation are in the $119-$120 area along with the quarterly pivot resistance.
- The RS line has been diverging from prices, line g, since the August lows.
- It shows a clear uptrend and the weekly RS line (not shown) has been leading prices higher for over six weeks.
- The daily OBV turned positive on August 13 and is well above its rising WMA.
- The weekly OBV is also above its WMA and therefore positive.
- The breakout support is at $114-$114.20 with the 20-day EMA at $113.14.
- The quarterly pivot is at $108.08.
What it Means: For many, the risk level in a sector ETF is more suited to their investment style than individual stocks. Before buying an ETF it is important that you Look Inside Your Sector ETF Before You Buy, which means analyze the holdings, expense ratio, and liquidity.
The sharp rallies in many of the retail stocks make a good risk:reward entry quite difficult. The SPDR S&P Retail (XRT) is a good way to get exposure to this sector especially for those not already in Select SPDR Consumer Discretionary (XLY). It was previously in the Charts In Play portfolio but longs were stopped out for a small 0.27% in July as my market concern convinced me to raise my stop. In order to control the risk, I would look for a pullback before buying XRT.
The Vanguard Health Care (VHT) provides a similar opportunity for those who want to gain exposure to the strong healthcare and biotechnology sector. I would not chase it on the long side and look to buy a bit lower.
How to Profit: For the SPDR S&P Retail (XRT) go 50% long at $86.51 and 50% long at $85.78 with a stop at $82.88 (risk of approx. 3.6%).
For the Vanguard Health Care (VHT) go 50% long at $113.92 and 50% long at $112.84 with a stop at $107.67 (risk of approx. 5%).
Portfolio Update: For the Select SPDR Consumer Discretionary (XLY) should be long at $63.92 with a stop at $64.74.
For the Select Sector SPDR Health Care (XLV) should be long at $38.50 with a stop at $55.47.


