The corrective patterns in some railroad stocks have been completed, so MoneyShow’s Tom Aspray takes to the charts to see if, in addition to an earlier transportation and railroad pick, there are any other opportunities in this key industry group.
In regular trading Wednesday, stocks were mixed as after a bounce on Tuesday, the Dow Utilities were hit hard again down 2.42% while the Industrials were unchanged as was the S&P 500. The recent technical outlook for the utilities indicates that their correction is not over yet.
After the close, the S&P futures jumped 8 points on news that a truce may have been reached in Ukraine. The EuroZone markets are showing nice gains in early trading with the German Dax up 1.5% and the broad STOXX 600 gaining 0.66%.
The futures have added further gains early Thursday, but with the Spyder Trust (SPY) currently up only 0.6% so far for the week, the action in the last two days of the week bears close watching. A higher weekly close will turn many of the weekly studies more positive.
The debate over the health of the economy continues with Retail Sales out this morning and Consumer Sentiment on Friday. One economically sensitive industry group has continued to lag the market in 2015 as the iShares Dow Jones Transportation (IYT) is down 2.14% YTD compared to a 0.68% gain in the Spyder Trust (SPY).
The corrective patterns in the railroad stocks I discussed last month in Are the Transports Turning the Corner? have been completed. Does this mean they are signaling a breakout in the transportation average? In addition to our earlier transportation and railroad pick, are there other opportunities in this key industry group?
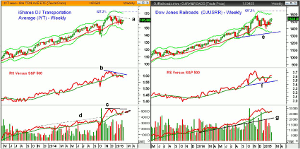
Chart Analysis: The weekly chart of the iShares Dow Jones Transportation (IYT) closed January below its 20-week EMA and the quarterly pivot at $156.15.
- IYT has rebounded from the correction low at $154.02 and closed the following week back above its quarterly pivot.
- There is further resistance at the downtrend, line a, in the $164.50 area.
- Longer-term resistance at the late December high of $166.17 with the weekly starc+ band at $170.05.
- The 127.2% Fibonacci retracement target is at $171.92.
- Though the monthly RS line is above its WMA, the weekly has been below its WMA in February.
- A move through the resistance at line b, is needed to turn it positive.
- The daily RS analysis (not shown) is also negative.
- The weekly on-balance volume (OBV) retested its breakout level, line d, before moving back above its WMA.
- A break in the OBV resistance at line c, will be positive.
The Dow Jones Railroad Index (DJUSRR) already appears to have completed its flag formation as the downtrend from the November-December highs has been broken.
- There is next resistance at 1544 with the weekly starc+ band at 1602.
- The 127.2% Fibonacci retracement target is at 1650, which is 7.5% above current levels.
- The weekly relative performance has completed its correction as it has moved above its WMA and the previous high.
- The weekly OBV made an impressive new high in December before correcting.
- The OBV has now moved back above its WMA.
- The monthly technical studies are clearly positive.
- There is initial support at 1471 and the 20-week EMA.
- There is more important support at 1394 which was the correction low.
Next: Two More Railroad Stocks to Watch
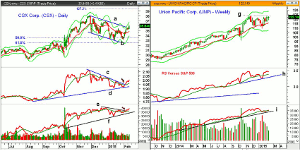
|pagebreak|CSX Corp. (CSX) is a $34.37 billion dollar company which has a yield now of 1.75%.The daily chart shows that Wednesday’s close completed its flag formation, lines a and b.
- There is next resistance at $36.96 and then at $37.94, which was the November high.
- The width of the flag has upside targets in the $38.50-$38 area.
- The 127.2% Fibonacci retracement target is at $39.50.
- The quarterly projected pivot resistance is at $42.98.
- The daily RS line has also completed its corrective pattern by breaking its downtrend, line c.
- The daily OBV has also broken through the resistance at line d, signaling the correction is over.
- CSX had dropped between the 38.2% and 50% correction levels prior to my recommendation, which signaled that the correction was likely over.
- The 20-day EMA is at $34.86 with the quarterly pivot at $34.61.
- The recent correction low at $33.21 is more important support.
Union Pacific (UNP) has been one of the bull market’s strongest stocks as it hit a low in March 2009 of $14.88. It has recorded strong double digit gains every year since 2009.
- The weekly chart shows that the all time highs, line g, are now being tested.
- The weekly starc+ band is at $128.59.
- The upside target from the weekly trading range and the quarterly projected pivot resistance are at $140.
- The weekly RS line moved above its WMA on Friday, January 23.
- It is well above the weekly support at line h.
- The weekly OBV peaked in December and moved back above its WMA last week.
- The daily technical studies are also positive.
- The 20-day EMA and initial support is now at $119.37.
What it Means: The iShares Dow Jones Transportation (IYT) needs a strong close to confirm that its correction is over. As per the earlier recommendations (see below), our buying zones in both IYT and CSX Corp. (CSX) were hit on the recent correction with the second levels just barely hit on February 2.
New longs in Union Pacific (UNP) require that you assume that its correction is already over so a tighter stop can be used.
How to Profit: For Union Pacific (UNP) go 50% long at $121.04 and 50% long at $18.88 with a stop at $114.39 (risk of approx. 4.6%).
Portfolio Update: For the iShares Dow Jones Transportation (IYT) should be 50% long at $156.74 and 50% long at $154.16 (the 1/30 low was $154.02) with a stop now at $152.79.
For the CSX Corp. (CSX) should be 50% long at $34.27 and 50% long at $33.22 (the 1/30 low was $33.21). Use a stop now at $32.37. Sell 50% of the position at $38.66 or better.


