
Historically, the Dow Utilities has a seasonal tendency to peak at the end of January and decline into May, so MoneyShow’s Tom Aspray uses technical analysis to determine if the current correction is a buying opportunity in the utilities.
Monday’s market decline was not too surprising after the rally stalled last Friday as even higher crude oil prices couldn’t boost stocks higher. In last week’s technical review Do Stocks Have Enough Juice to Breakout?, I pointed out that while the majority of daily technical studies were still range bound, the weekly analysis did point higher.
This is still the case and it is why a higher close this week will help resolve the market’s outlook. Typically, this would mean that the market’s correction should be over soon and the futures are showing nice gains in early trading.
The Dow Transportation and Dow Utility Average were two of the biggest losers last week as they were down 1.03% and 0.96%, respectively. The utility stocks have been hit the hardest recently as the Sector Select Utilities (XLU) is down 6.6% since its yearend close.
In polls of institutional money managers, this sector has been one of the least favorite sectors since 2013. It has had a couple of pretty good years as XLU was up 13.05% in 2013 and 28.73% last week.
Looking back to the early 1930s, the Dow Utilities has a seasonal tendency to peak at the end of January and decline into May. Of course, with a further decline in price, the yields are getting even more attractive so is this correction a buying opportunity in the utilities?
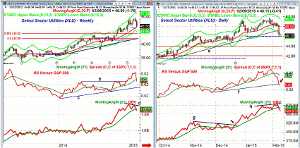
Click to Enlarge
Chart Analysis: For the Sector Select Utilities (XLU), the ETF has total assets of $8.01 billion and a current yield of 3.12%. There are a total of 30 holdings with Duke Energy (DUK) (9.3%) and NextEra (NEE) (7.9%) the two largest. There are 59% of the assets in the top ten holdings.
- The decline last week took the XLU below the January lows as it closed just above the quarterly pivot at $46.03.
- XLU is now not far above support from November and December in the $44.44-$44.73 area.
- The 20-weekly EMA has also been tested with the weekly starc- band at $44.55.
- The 38.2% Fibonacci support from the June 2013 lows is at $43.92.
- The 50% support is at $42.08, which coincides with the year long weekly uptrend, line a.
- The weekly relative performance did make a new high just two weeks ago before dropping sharply.
- The RS line has dropped below its WMA and is back to the breakout level, line b, from last year.
- The monthly RS line is still well above its WMA.
- The weekly OBV did form a short-term negative divergence at the recent highs, line d.
- The OBV is now below its WMA which is starting to flatten out.
The daily chart of the Sector Select Utilities (XLU) shows that last Friday’s sharp drop violated the daily uptrend, line e.
- XLU dropped further on Monday to close just above the daily starc- band.
- The daily RS line did make a new high on January 28, but then dropped below its WMA three days later.
- The RS line has also now violated its short-term uptrend, line f.
- The daily on-balance volume (OBV) broke through resistance, line g, in December.
- The OBV did confirm the recent highs, line h, but has just dropped below its WMA.
- There is initial resistance now in the $47 area with the 20-day EMA at $48.
- The monthly pivot is just slightly higher at $48.25.
Next: Two More Utility Stocks to Watch
|pagebreak|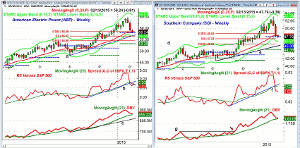
Click to Enlarge
American Electric Power (AEP) is a $28.5 billion public utility holding company that has a current yield of 3.54%. It pays a dividend of $2.12 with a low current ratio of 0.56. Since 2004, it has steadily increased its dividend.
- Since it peaked at the end of January at $64.83, it has dropped 10.9%.
- The short-term 38.2% support from the August low has now been reached.
- The 50% support is at $56.52 which also corresponds to the support (line a) as well as the starc- band.
- The 61.8% support is at $54.56 with the quarterly projected pivot support at $53.29.
- The weekly RS line did make a new high with prices but has recently plunged.
- The support, at line b, and the WMA of the RS line have been broken.
- The monthly RS line did confirm the high and is above its WMA.
- The weekly OBV (the Best Volume Indicator) has pulled back to its WMA but did confirm the recent highs.
- There is first resistance now in the $60 area with the declining 20 EMA at $60.27.
Southern Company (SO) is a $43 billion electric utility that is focused on four southern states. It has a yield of 4.4% with a current dividend of $2.10. It has a current ratio of .90.
- SO spiked to a high of $53.16 at the end of January but is now down over 10% from this high.
- The 38.2% support at $48.62 has been violated.
- The 50% support from the August low is just a bit under Monday’s close at $47.23.
- The weekly starc- band is at $46.61 with important support from last May’s high (line d) now at $45.30.
- The weekly RS line made a significant new high in 2015 before dropping sharply.
- Both the support from the recent lows, line f, and the WMA have been broken.
- The OBV staged and impressive move through resistance, line g, last October.
- The monthly indicators have turned lower but did confirm the highs.
- There is first strong resistance at $49.44 with the declining 20-day EMA at $50.27.
What it Means: I think the current correction is a buying opportunity in the utilities but it could take 3-4 weeks or more before the correction is over.
I think the Sector Select Utilities (XLU) is the best bet on a drop to even stronger support where the yield will be even higher. Of the two utilities, Southern Company (SO) looks the strongest, but would wait for new buy signals or a drop to longer-term support.
How to Profit: For Sector Select Utilities (XLU) go 50% long at $45.76 and 50% long at $44.64 with a stop at $43.39 (risk of approx. 4.2%).


