Blake Robben of Archer Financial Services outlines the ins and outs of technical analysis and he offers, what he considers, the keys to success for studying charts, regardless of timeframe or whether the trader is looking at the chart of a stock, a market index, or a commodity.
The price is the end result of the battle between the forces of supply and demand for anything that is tradable. The objective of any type of market analysis is to forecast the price direction. By focusing on price and only price, the art of technical analysis represents a very direct approach.
Fundamentalists are focused on why the price is what it is. For technicians, the why portion of the equation is too broad and many times the fundamental reasons given can be vague and highly suspect. Technicians believe it is best to concentrate on what part of the market and never mind why. Why did the price go up? It is simple, more buyers (demand) than sellers (supply). After all, the value of any asset, tangible, or intangible is only what someone is willing to pay for it. Who needs to know exactly why? The beauty of technical analysis lies in its versatility. Keep in mind the principles of technical analysis are universally applicable. A trader doesn't need an economics degree to analyze a market index chart and it is not necessary to be a CPA to analyze a stock chart. Charts are charts. It does not matter if the timeframe is two days or two years. It does not matter if it is a stock, a market index, or a commodity.
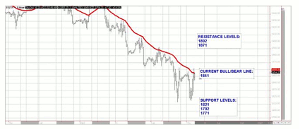
E-mini S&P

Charts from QST
Click to Enlarge
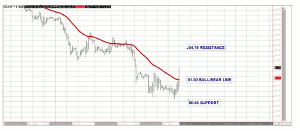
Crude Oil

Charts from QST
Click to Enlarge
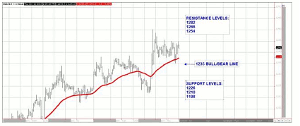
Gold

Charts from QST
Click to Enlarge
The technical principles of support areas, resistance areas, trends, trading ranges, and other aspects can be applied to any chart. While this may sound simple, technical analysis is by no means easy. Success requires serious study, dedication, along with an open mind.
By Blake Robben of Archer Financial Services


