A booming stock market has resulted in lackluster interest in precious metals, which leads MoneyShow’s Tom Aspray to examine the charts to see whether now would be a good time to buy into metals and miners.
Better than expected Durable Goods data and a strong report from Markit’s PMI Services index gave the stock market an early boost. This helped encourage the bulls and stimulated further short covering as one widely followed market bear threw in the towel.
As I suggested yesterday, the Spyder Trust (SPY) likely needs several consecutive closes at current levels to trigger additional short covering. The positive economic news did not convince the bond market as yields declined slightly but those in the precious metals were hit hard as the gold futures lost 2%.
The apparent lessening of tension in Ukraine was given some credit for the decline but the expiration of June Comex options likely played a much larger role.
There were technical signs in mid-May, Gold Miners Fail to Launch, that the rebound had failed and that the next significant move would be to the downside. As I have noted previously, the analysis of seasonal experts like John Person reveals that gold typically tops in February and then bottoms in late July or even early August.
After yesterday’s 3.8% drop in the Market Vectors Gold Miners ETF (GDX) and 1.6% drop in the iShares Silver Trust (SLV), many are wondering whether the metals and mining stocks have now reached good levels to buy?
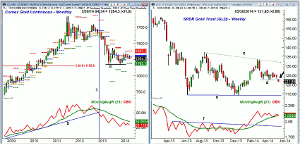
Chart Analysis: The monthly chart of the Comex gold continuous contract suggests we may close May below the prior two-month lows.
- There is next support in the $1240-$1250 area.
- The quarterly projected pivot support is at $1193.10, which is about 5.7% below current levels.
- There is further chart support, line a, in the $1179-$1183 area.
- The 61.8% Fibonacci retracement support from the October 2008 low is at $1155.90.
- The monthly OBV dropped below both its support, line b, and its WMA in January 2013.
- The OBV shows a pattern of lower lows but has not yet dropped below the December 2013 lows.
- The weekly OBV (not shown) does look more positive but is also now below its WMA.
The weekly chart of the Spyder Gold Trust (GLD) shows that it gapped lower to start the week as it closed Tuesday below the support at $122.84, line d.
- Of course, it is the close on Friday that will be more important.
- Using current data, the monthly projected pivot support for June is at $118.53.
- The quarterly pivot support is at $115.93 with major chart support, line e, at $114.46.
- The weekly chart shows what may be a major flag formation, lines c and e.
- The 127.2% Fibonacci target from the flag formation is at $108.56.
- The completion of the flag formation has downside targets in the $95-$100 area.
- The weekly OBV on GLD is acting stronger than prices as it broke through resistance, line f, in late January.
- The OBV is still above its WMA but could violate it by Friday.
- The daily OBV (not shown) has been below its WMA since early March and still looks weak.
- The quarterly pivot and first strong resistance is at $124.80.
NEXT PAGE: Gold & Silver Have Lost Their Shine
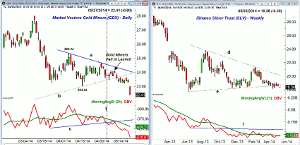
|pagebreak|The Market Vectors Gold Miners (GDX) has a daily seasonal tendency to rally in May but the break of OBV support on May 8 (line 1) was a negative sign.
- The flag formation, lines a and b, was confirmed on May 16, two days after the OBV warning.
- The minor 127.2% Fibonacci target at $22.51 has already been met with May’s monthly projected pivot support at $21.86.
- There is quarterly support at $20.57 with downside targets from the flag formation in the $20.50-$20.70 area.
- The OBV plunged on Monday as volume was 42.7 million versus the average of 29.7.
- The OBV is well below its sharply declining WMA.
- The weekly OBV (not shown) dropped below its WMA in early May, and the WMA is now clearly declining.
- There is minor resistance at $23.60 with the quarterly pivot at $24.30.
The iShares Silver Trust (SLV) tracks silver prices and shows the formation of what appears to be a bear flag formation, lines d and e, over the past year.
- The weekly OBV broke support in the fall of 2013, line f, which now becomes important resistance.
- The OBV has stayed well below this resistance all year.
- It appears the OBV will also fail to move above its WMA this week.
- A drop in the OBV below the early May lows would be even more negative.
- The daily OBV (not shown) has already dropped to new correction lows.
- There is quarterly pivot support now at $16.67.
- The measured targets from the flag formation range from $15.70 to $13.00.
What It Means: Both silver and gold, as well as the miners, need to have a rapid reversal to the upside to avoid dropping significantly lower. There are mixed signals from the monthly, weekly, and daily OBV but it would take positive signals from the daily OBV to signal that these market were stabilizing.
With a weekly close near current levels it would likely take three-five weeks before a bottom could be formed.
I do not really see a good trade in any of the inverse ETFs that track the metals or the miners as I recommended liquidating light longs in the Market Vectors Gold Miners (GDX) on May 14 for a small profit.
How to Profit: No new recommendation.


