MoneyShow's Tom Aspray often uses Fibonacci analysis to determine likely entry points and profit targets for his Charts in Play recommendations. Here, he uses a few recent examples to examine more closely how he establishes these preferred buy levels.
In determining whether a market is likely to go up or down, I first look at the monthly, weekly, and daily charts. This step often is enough for me to determine which ones need more careful analysis.
In the second phase, on-balance-volume and relative performance analysis play a primary role, though other technical tools are often also used.
Once I find a market that I think has a high probability of going up or down, then further work must be done in order to determine an entry level, potential stop, and price objective.
I come across a number of markets each week that I think show a good potential to rise or fall 10% to 15%, but they are dismissed as they do not present any reasonable risk strategy at current levels. Often, I will determine that risking 5% to make 10% to 12% is not worth it.
When I am looking to buy or sell a market that is correcting against a major trend, Fibonacci retracement analysis plays an important role in helping me determine a possible entry point, as well as a profit objective.
In this article, I would like to review some current as well as past markets to show you the process that I use to identify a market to trade, and how Fibonacci analysis is included to determine not only entry but also exit levels.
Since the start of the summer, I have been watching the gold market, as I was aware of the seasonal tendency for it to bottom in the latter part of July. Since the highs in September of 2011, I have been looking for a correction within the major trend that would last long enough to reverse the extreme bullish sentiment that prevailed last summer.
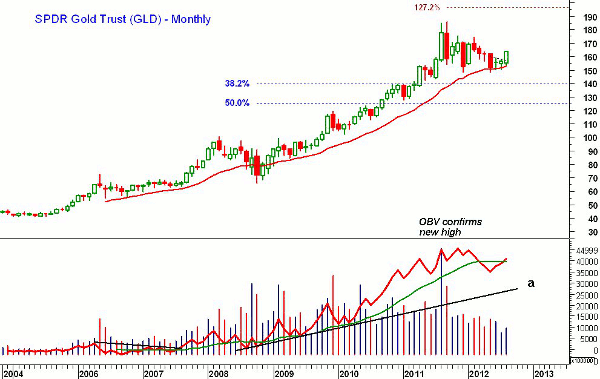
The major support level for the SPDR Gold Trust (GLD) that I identified soon after the top was the 38.2% Fibonacci retracement support level at $140, which was calculated from the October 2008 low of $66 and the September 2011 high of $185.85.
For those who are not familiar with Fibonacci analysis, a violation of this level would have indicated a further decline to the major 50% support at $135. (To learn more, read Fibonacci Analysis: Master The Basics.)
Next: Confidence in the monthly OBV
|pagebreak|The fact that the monthly on-balance volume (OBV) had confirmed the highs in September 2011 made me confident that a major top was not in place. As of the end of August 2012, the monthly OBV had moved back above its WMA which is a positive sign.
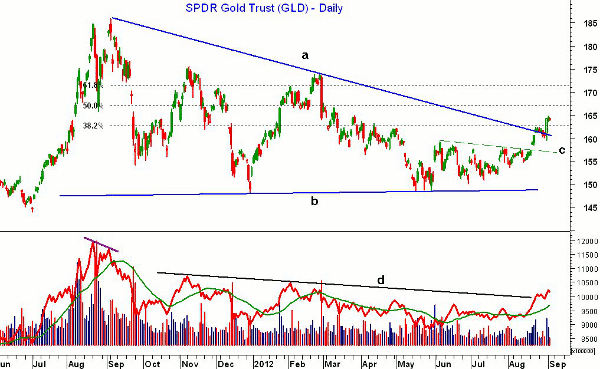
GLD made a low of $148.27 on December 29 (missing my buy level of $148.20), then rallied 17% over the next two months. The sharp reversal on March 1 and the poor volume on the rally suggested that the corrective period for gold prices was not over.
In May, the sentiment had become more negative, which suggested the worst of the correction was over.
On June 8, after GLD had rallied to a short-term high of $159.20, I recommended going 50% long at $152.42 and 50% long $150.28, with a stop at $147.28 (meaning a risk of approx. 2.6%). This first buy level represented a point between the short-term 50% and 61.8% support level, while the second level was just above the psychological support at $150.
I wanted to give the position enough room under the December low of $148.27
so as to not get stopped on a quick downdraft. I was concerned that a decisive
break of the December lows could lead to a test of the major 38.2% support
level.
In the past week, GLD has overcome the downtrend on the
daily chart and completed the triangle or flag
formation (lines a and b). The ability of GLD to overcome the 38.2%
Fibonacci retracement resistance sets the next upside target at $167, which is
the 50% retracement level.
The key 61.8% level is at $171.50, which is not far below the significant chart resistance from November 2011 and February 2012 in the $174 to $175.46 area. The daily OBV has broken through the resistance (line d) that goes back to last November. The weekly OBV (not shown) also indicates that an important low is in place.
A daily close above the 50% and of course the 61.8% retracement resistance would further support a move to new highs. The 127.2% Fibonacci retracement target on the monthly GLD chart (see figure 1) is at $196, and that is where I would be looking to take some partial profits.
GLD is a tough buy here, as the first minor support is in the $157 to $158.50 area (line c) with further levels at $154.80. Therefore, the risk of buying now is a bit too high for my liking. If the rally stalls near current levels, a setback into this support zone over the near term should set up a new buying opportunity. Sentiment has quickly turned more bullish, so this is a possibility.
In my opinion, it is more likely that GLD will test stronger resistance before the first rally phase is completed. The next daily sell signals should be followed by a correction back to the 38.2% to 50% support level, where additional buying can be done.
Next: Using the longer term OBV and RS analysis
|pagebreak|I have found that using the longer-term OBV and RS analysis can be one of the best ways to determine whether a correction is a buying opportunity or not. Specifically, I look for the monthly OBV and RS analysis to confirm a major new high, and then develop a strategy to buy on the correction.
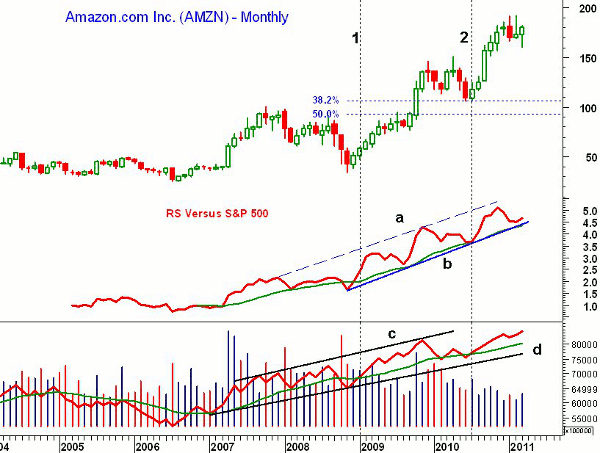
Amazon.com (AMZN) is a good case in point. Its correction from the 2007 high of $101.09 had a classic a-b-c pattern, and at the end of January 2009 (line 1), the monthly RS line moved back above its WMA. The relative performance confirmed the 2007 highs.
The monthly OBV formed higher highs in 2007 and 2008 (line c), and had a strong uptrend (line d) from the 2007 lows. The OBV was already back above its WMA as the overall market was bottoming (line 1).
The rally from the lows at $34.68 lasted until April 2010, as AMZN reached a high of $151.09. This was just above the 161.8% target from the 2007 to 2008 correction, which was at $142.62. The 127.2% Fibonacci retracement target at $119.49 was hit 11 months after the lows.
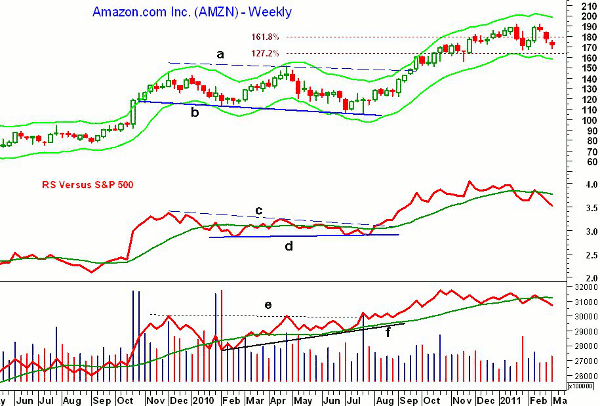
AMZN dropped to a low of $106.01 in June 2010, which was just below the 38.2% Fibonacci retracement support from the 2008 low of $106.62. The weekly chart of AMZN shows that this decline also tested trend line support (line b) and prices were also close to the weekly Starc- band.
There were several bullish factors heading into these lows that favored having resting buy orders in the market. The monthly OBV and RS had been confirming the price action and had long-term bullish patterns. The weekly analysis also suggested AMZN was correcting, not topping, and the RS line had formed a continuation pattern (line c and d).
The weekly OBV was holding well above its flat WMA in June and was forming higher lows (line f), unlike prices. Typically, I look to buy at just above the 38.2% support, and then try to do additional buying below this support.
For the stop, using one under the 2007 high of $101.09 as well as the psychological support level of $100 was a reasonable approach. Under the 50% support at $92.89 was too wide. Round-number stops are a bad idea, but a stop of $99.28 should have been wide enough to protect against any transitory breaks of the $100 level.
As for the buy level, 0.5% above the 38.2% support at $106.62 would have worked out to be $107.15. As for a second buy area, the mid-point from the high of $101.09 and the 38.2% support at $106.62 would be $103.85. This would work out to an overall risk of 5.9%.
With the upside target, I prefer scaling out of long positions, as it helps reduce the overall risk to the portfolio and can be positive psychologically. Selling just below the prior high of $151.09 would have been a valid approach.
My main target would have been the 127.2% Fibonacci retracement target from the $151.09 high to the $105.66 low, which was at $163.45. Therefore, attempting to sell at 1% to 0.5% below this level, say at $161.80 to $162.60, would have been the plan.
As it turned out, AMZN eventually exceeded the 161.8% Fibonacci retracement target at $179.17, eventually reaching a high of $191.60 in January 2011. (For my current Fibonacci analysis of AMZN, see last week's column.
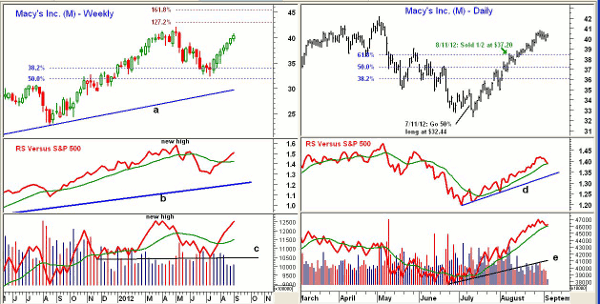
Next: Let's look at Macy's |pagebreak|For the final example, let's look at Macy's (M), which I recommended on July 11. The stock had peaked in early May at $42.17, and the new highs were confirmed by the monthly as well as the weekly RS and OBV analysis.
Looking at the rally from the August 2011 lows, the 38.2% support was at $34.66, and had already been decisively broken in June. The 50% support was at $32.35, with the 61.8% support at $30.04.
Despite the corrections in June, the RS line had held well above its long-term uptrend (line b) and the OBV also held above support. The daily chart shows that the low at $32.31 came on July 12. The daily relative performance did not confirm the lows, as it formed a short-term positive divergence.
The daily OBV bottomed in June (line e) and also formed a bullish divergence at the lows. The major upside targets were the prior high of $42.17 and then the 127.2% Fibonacci retracement target at $44.67.
A week after longs were established, Macy's had surpassed the previous swing high, confirming a bottom. By early August, the weekly OBV had moved back above its WMA.
The 50% retracement resistance from the April high was surpassed in early August, and just a few days later the 61.8% resistance was also being challenged. With earnings out in just a few days, I then decided to recommend selling half the position. The earnings were strong and Macy's rallied further on the report.
Though the market is now much higher, I felt comfortable taking a quick 14.6% profit, as the overall market was not looking that strong and an earnings downdraft can never be ruled out. If the technical readings for the overall market had been stronger I would have been more likely to hold on to the entire long position.
I hope this lesson will give some of my regular readers a bit more insight into how I come up with my recommendations. In my daily column, I often do not go into as much detail, and thought it might be helpful.
I have found over many years that Fibonacci levels give my analysis an additional degree of discipline and have often kept me out of trouble. In the past few years, I have also learned quite a bit from John Person about his unique method of pivot-point analysis. When his pivot points and the Fibonacci analysis identify the same price levels, one has an even higher degree of confidence.
Even if you are trading or investing based on the daily charts, take the time to look at the weekly and monthly analysis, as I think it will help you in the long run.

