Using monthly and weekly charts, MoneyShow's Tom Aspray analyzes these two tech giants to find out not only their near-term targets, but also the technical strength of their long term trends.
As stocks have moved steadily higher since the early June lows, there have been many who have questioned the sustainability of the rally because of the weak economic numbers, as well as what some see as narrow leadership. Recent data on the economy continues to indicate sluggishness.
While the Spyder Trust (SPY) is up 11.3% from the June lows, market leaders like Apple (AAPL) and Amazon.com (AMZN) have gained 28.9% and 19.7% respectively.
Since the Powershares QQQ Trust (QQQ) has a 19% holding in AAPL, many have been very cautious about buying any stocks as they have been unable to trust the rally. The patent award has also increased the bullish sentiment on Apple (AAPL)
As I will discuss in more detail in Friday’s column, the current analysis of the market internals, though positive, does not currently suggest that stocks are ready to accelerate to the upside. There are also no signs of a sustainable market correction...but that could change if these two market bellwethers weaken as they reach our next upside targets.
The combination of the monthly and weekly analysis can help identify not only the upside targets, but also the strength of the major and intermediate-term trends for these two key stocks.
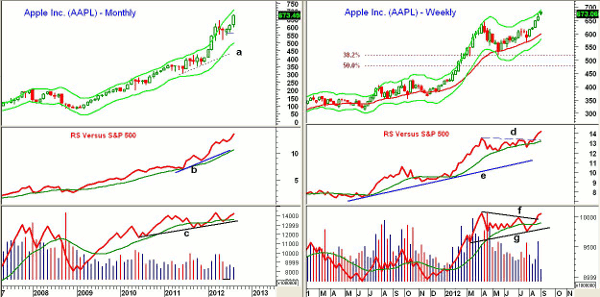
Chart Analysis: The monthly chart of Apple (AAPL) shows that it traded well above the monthly Starc+ bands in March and April, before undergoing a 19% correction.
- For September, the monthly Starc+ band is at $709.85, which is 5.4% above Thursday’s close.
- The 127.2% Fibonacci retracement calculated from the April-May correction is just above the recent highs at $681. The 161.8% target is $722.
- The monthly RS analysis continues to look very strong, as it will make new highs this month.
- The RS line is well above its uptrend (line b) and its rising WMA.
- The monthly on-balance volume is very close to the March highs, and is well above its WMA and support (line c).
- There is first monthly support in the $600 area.
The weekly chart of Apple (AAPL) shows that this week’s Starc+ band at $678 is now being tested. For next week, the Starc+ band is at $689.
- AAPL looks ready to close higher for the fifth week in a row.
- The weekly relative performance moved through resistance (line d) several weeks ago, and has confirmed the new price highs.
- Typically a breakout of a five-week trading range in the RS line is consistent with a rally that can last for some time. Note what happened in early 2012.
- The weekly on-balance volume (OBV) has also broken out of its trading range (lines f and g).
- There is first weekly support at $654, with further in the $620 to $640 area.
NEXT: Key Levels to Watch for Amazon
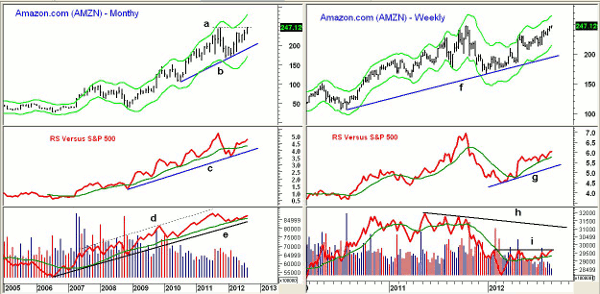
|pagebreak|Amazon.com (AMZN) has just surpassed the October 2011 highs at $246.71 (line a). The monthly Starc+ band for September is at $280, which is 13.3% above Thursday’s close.
- The monthly trading range has upside targets in the $300 to $310 area.
- The monthly relative performance moved above its WMA at the end of April, and is holding well above its WMA.
- The RS line did make a new high with prices in September 2011, but is still below those highs.
- The monthly OBV has been just edging higher for the past few months, but has been above its WMA since January 2009, when AMZN was trading at $58.
- The monthly OBV has formed a series of higher highs (line d) which is bullish for the major trend
- There is first good monthly support in the $207 area.
The weekly chart of Amazon.com (AMZN) shows a gradual rally over the past few weeks, and next week the Starc+ band is at $262.60.
- There is initial support now at $230 to $235 and the May highs. There is more important weekly support now in the $211 area.
- The weekly relative performance completed its bottom in April, and continues to hold above its rising WMA.
- There is more important support at the uptrend (line g).
- The weekly OBV is lagging the price action. While it is above its WMA, it is still below the resistance (line i).
- The OBV has more important long-term support at line h.
What it Means: Of these two market leaders, Apple (AAPL) clearly looks the best, and if we get a sharp setback in the next month or two, it is likely to be a buying opportunity.
Even the hourly relative performance analysis that I discussed in a recent article is still positive for AAPL. Next upside targets stand in the $709 to $722 area.
The weekly OBV analysis of Amazon.com (AMZN) is a concern, and I would only look to do new buying on a sharp pullback, as our recommended buy level from early in the year was not filled. The next likely upside target for AMZN is in the $260 to $263 area.
If either trades above the monthly Starc+ bands, it would be a level where longs could be hedged, especially in AMZN.
How to Profit: For Amazon.com (AMZN), go 50% long at $230.40 and 50% long at $218.40, with a stop at $210.40 (risk of approx. 6.2%).
Portfolio Update: Investors should be 50% long Apple (AAPL) at $567.50, with a stop now at $584.20.


