This is not the time to chase prices, which is especially dangerous with speculative margin levels reaching the point where they could add serious fuel to any downturn. Position yourself smartly, be alert, and take profits where you can, writes MoneyShow's Tom Aspray.
Stocks finished the week with nice gains, as even though the market was lower most of Friday, once again late buying pushed the major averages back into positive territory.
For the week, the ranges in some of the other world markets, like gold, were much more dramatic. The yellow metal was hit hard Friday, as expected.
Stocks spent most of the week responding to earnings reports, as there was little in the way of economic data. The new highs in the major averages were confirmed by the market internals, and the number of stocks on the NYSE making new highs surged to over 500, which was above the January high.
The financial networks almost appear to be showing reruns; many fundamentalists either argue for much higher prices or that the market is ready to fall off the cliff.
Traders continue to act skeptical without being too bearish, as the market has been finishing days higher despite early declines. Once we get the first strong down day, their attitudes are likely to change significantly.
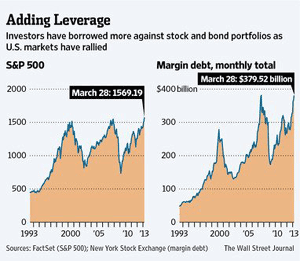
There was some data on margin debt last week that I found surprising. As of the end of March, investors had $379.5 billion in margin debt, which was just below the prior record of $381.4 billion set in July 2007. But is this something investors should be concerned with?
Twenty or 30 years ago, I think there was a closer correlation with speculative excess than there is now. For many, the interest rate on margin debt is lower for consumer loans, and the margin debt is also tax deductible. This can help to explain the 28% increase in margin levels over the past year.
As was evidenced by the plunge in gold prices, many traders were forced to sell their gold positions to meet margin calls, pushing prices even lower. So as you can see, it can accentuate a severe market decline. In my opinion, it is not a reason to sell, but is just another sign of the increasingly positive attitude toward the stock market.
Much of the focus for the week was on Japan and the continued weakness in the yen. The country's monetary policy is having a very positive impact on its exporters. Meanwhile, the US dollar has been gaining strength against many currencies. This has added additional pressure on the precious metals.
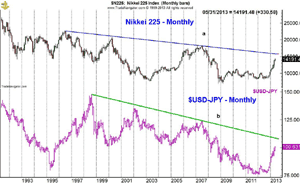
Some analysts are still taking the view that the move in Japan's Nikkei-225 and the yen is almost over. But a longer historical view might convince them otherwise.
The monthly chart of the Nikkei-225 and USD/JPY only goes back to 1992, and does not show the Nikkei's high of 38,952 in December 1989. The downtrend from just the 1995 and 2007 highs is still above the market in the 16,000 area. It also does not reflect that USD/JPY made a high soon after the stock market peaked, at 160, nor that it traded at 303 in 1975.
The downtrend of the USD/JPY is now above 108, but a move this year to 125 would not surprise me at all. This makes the recent action look less impressive, though the length of the decline in these markets increases the odds that a major bottom is being formed.
I would expect to see a decent pullback in these markets in the coming months, which should present a much better buying opportunity than chasing prices at current levels. Prices right now are too far above meaningful support.
NEXT: What to Watch
|pagebreak|Many of the overseas markets are also acting well. The German Dax made another new high last week, and several of the other country ETFs also broke out to the upside. A new recommendation was made in the iShares MSCI Mexico Investable (EWW), and the holdings in Singapore and Indonesia have done quite well.
In contrast to last week, there are quite a few important economic reports due out this week. They start Monday with retail sales and business inventories. Last week's same-store sales data suggests April may be better than March's disappointing results, as lower gas prices have helped.
On Tuesday, we get import and export prices, followed on Wednesday by the Producer Price Index, industrial production, and the Housing Market Index.
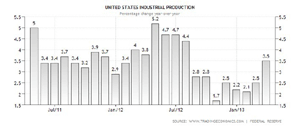
Industrial production in the US was stronger than expected last month. The chart actually shows steady improvement over the past three months. Globally, it is a mixed bag; while UK numbers were better than expected, those from Mexico were much weaker.
In addition to the jobless claims, on Thursday we also get the Consumer Price Index, housing starts, and the Philadelphia Fed Survey. Finally, on Friday we have the mid-month reading on consumer sentiment from the University of Michigan and the Conference Board's Leading Indicators.
What to Watch
The rotation into technology has been a big plus for the market. You are starting to see money moving out of the more defensive sectors. This is consistent with the improved outlook for the economy, and will be a positive factor as the year progresses.
The ability of the S&P 500 to reverse to the upside in April after briefly violating the widely watched 1,540 level has hopefully taught many that any one price level is not that important unless there are other signs of weakness.
Everyone now appears to be watching the 1,595 to 1,600 level, and then the 1,570 to 1,580 area. A break of this lower level would be negative if accompanied by confirmation from the other technical studies.
Bullish sentiment of individual investors jumped sharply last week, according to AAII, as 40.7% are now bullish, up from 30.9% last week. The bearish percentage has now declined to 27.4%.
Financial newsletter writers have also become more bullish now, at 52.1%, which is up from 44.3% two weeks ago. These numbers could reach more extreme levels in a few more weeks.
NEXT: Stocks
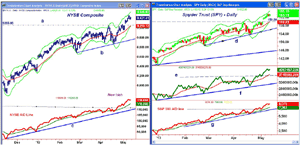
|pagebreak|The daily chart of the NYSE Composite, below, shows the recent breakout above the resistance at 9,265 (line a). This now becomes the first good support. This also now corresponds to the rising 20-day EMA and the daily Starc- band. Thre is more important support in the 9,000 area (line b).
The daily Starc+ band was tested last Wednesday, with the upper band now at 9,545. It is still over 300 points below the May 2008 high of 9,724. This also corresponds to the upper boundary of the trading channel on the weekly chart (not shown).
The daily NYSE Advance/Decline made another new high last week and is still well above its strongly rising WMA. In early 2013, the WMA was rising at a similar angle. There is support at the April highs and then at the uptrend (line c).
S&P 500
The daily chart of the Spyder Trust (SPY) made a high last week of $163.70, which is not far below the quarterly R2 resistance at $164.58. This week, the Starc+ band is at $165.50.
The daily on-balance volume (OBV) broke out above resistance (line e) in the latter part of April and continues to act strong, as its WMA is in a clear uptrend. The weekly OBV (not shown) made another new high last week, and is confirming the price action.
The daily S&P 500 A/D line signaled the most recent rally phase by moving through its resistance. It made another new high last week. A break of its WMA and support (line g) would be the first sign of a more meaningful correction.
There is support now in the $159.80 area, with additional support at $156.20 and the uptrend (line b).
Dow Industrials
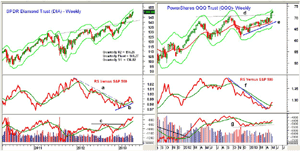
The SPDR Diamond Trust (DIA) made another new high last week, as the Dow Industrials crested the 15,000 level. DIA reached a high of $151.37, with the Starc+ band at $152.60. The recent trading range still has measured upside targets in the $153 to $154 area.
The daily Dow Industrials A/D line (not shown) again made new highs last week, while the relative performance has dropped back below its WMA and is now testing its uptrend (line c). The RS line broke its downtrend (line b) in February.
The weekly OBV made new highs last week after staging an impressive break through its resistance (line d) at the start of March. Initial support now sits in the $148.20 to $149.60 area.
Nasdaq-100
The impressive recent action in the PowerShares QQQ Trust (QQQ) even shows up on the weekly chart, as it already quite close to the weekly Starc+ band at $73.80.
The move above the September high makes the $70.58 area (line d) a first key support level. The 20-week EMA is now at $68.60, with the weekly support (line e) at $68.
The relative performance broke its downtrend (line f) in the middle of March, and now appears to have completed its bottom, as it has moved well above its WMA. The weekly OBV has moved out of its tight range, but is still well below the September highs.
The weekly Starc+ band is at $72.55, with the monthly at $75.80. The breakout completed a trading range about ten points wide, so this gives upside targets in the $80 to $81 area.
NEXT: Sector Focus, Commodities, and Tom's Outlook
|pagebreak|Russell 2000
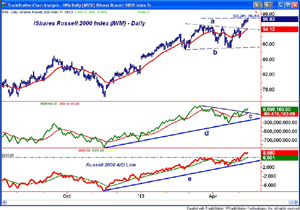
The iShares Russell 2000 Index (IWM) shows the completion of a classical flag or continuation pattern (lines a and b). The 127.2% Fibonacci target has already been met.
After such a breakout, a pullback to the breakout level would not be unusual. And it coincides currently with the 20-day EMA at $94.11.
The measured target from the flag formation is in the $99 to $101 area.
The daily OBV broke through the resistance (line c), completing the corrective pattern, and is now acting quite strong. The pullback in the OBV to its WMA was a good buying opportunity.
The Russell 2000 A/D line also made new highs last week. First support sits at the uptrend (line e) and the March highs.
Sector Focus
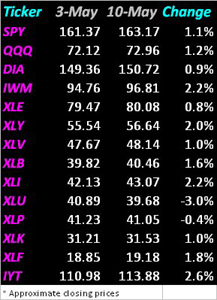
The iShares Dow Jones Transportation (IYT), after completing its the continuation pattern the previous week, accelerated to the upside. It was one of the strongest sectors, up 2.6% for the week.
Both the weekly and daily OBV ( not shown) are positive, so further gains are likely. The quarterly R1 has been surpassed, with the R2 resistance now at $120.69.
The defensive sectors were the losers last week, led by the 3.0% loss in the Select Sector SPDR Utilities (XLU). The Select Sector SPDR Staples (XLP) was down just slightly.
The small caps acted the strongest last week, as IWM was up about 2.2%, almost double the gains of SPY and QQQ. The Select Sector SPDR Consumer Discretionary (XLY) and Select Sector SPDR Industrials (XLI) were both up 2%.
The Select Sector SPDR Health Care (XLV) rebounded last week to close higher, and the volume was quite heavy, confirming the new all-time high.
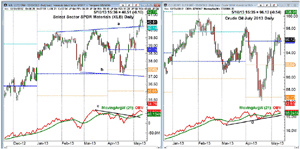
As I discussed last week, the Select Sector SPDR Materials (XLB) was on the verge of an upside breakout, and it was in fact able to close above resistance (line a). The upside breakout was confirmed by the OBV, which moved through its resistance (line c). Important support is now found at $38.47, which is the quarterly pivot.
Crude Oil
Crude oil had a wild session Friday. The July contract dropped as low as $93.62 before closing back above $96 per barrel. The close was just barely back above the quarterly pivot at $95.91.
A close above the early April high at $98.22 is needed to reassert the uptrend. The OBV is above its WMA, and shows a pattern of higher highs and higher lows (line d).
Precious Metals
The technical action of the precious metals with Thursday's close suggested the rally was running out of steam, but I did not expect such a sharp drop. The Spyder Gold Trust (GLD) closed above its lows, but technically there are no signs of a bottom yet.
The Week Ahead
It is still a tough market. Despite further new highs Friday, finding good new stocks or ETFs to buy with reasonably low risk is still difficult. In last Thursday's column, April's Picks & Pans, I took a look at two of my winners and two losers from April's columns.
In my regular monthly analysis of the Dow Industrials, I made a few new recommendations, but my buy levels have not yet been hit. I am still waiting for a pullback in some of the global ETFs, especially those for Japan and China, to establish new positions.
In my update of the Charts in Play Portfolio, I raised some more stops and put in a few more profit-taking levels. Despite the high level of cash, it is performing fairly well.
With another strong close Friday, the temptation is to jump in. Don't-there will be better opportunities down the road.
- Don't forget to read Tom's latest Trading Lesson, A Candle Trigger for Market Bottoms
- Tom will be out of town next week. The next Week Ahead column will be published on May 24.

