In tandem with the US stock market, global stock markets likewise scaled new heights, and MoneyShow's Tom Aspray looks overseas for new buying opportunities.
The German Dax closed up 0.86% Monday as it has made a new all-time high this week. Japan's Nikkei 225 had been closed since May 2 and gained 3.5% when it reopened on Tuesday. For the year, the Nikkei 225 is up over 36% powered by the sharply lower yen.
The outperformance of some of the overseas markets has been going on for some time, and in early November, I suggested that investors look overseas. The DAX peaked in the middle of March, and like many of the Eurozone markets, corrected more than the S&P 500 or Spyder Trust (SPY).
Many of these markets have now completed their continuation patterns as they have broken out of their trading ranges. This confirms the strong action in the US markets and these charts make a persuasive case for a further stock market gains.
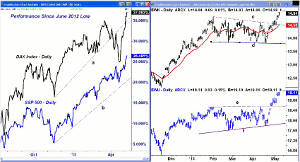
Chart Analysis: The performance chart of the Dax index shows that it was up over 35% on March 14 but just over a month later it was only up just over 24%.
- The uptrend, line a, was broken in early April and the drop below 7500 was a negative sign.
- When an important technical level is broken, it is important to watch the first rally.
- In this case, the DAX was strong the first two days after the lows, and six days later, it closed back above the quarterly pivot at 7851.
- The quarterly R1 level at 8166 was overcome this week with the R2 at 8389.
- The first good support is at the breakout level at 8030-8075 and then at the quarterly pivot.
The S&P 500 had a little over a 4% pullback in April before accelerating to the upside.
- The S&P 500 is currently up close to 26.5% since June 2012.
- The quarterly R2 resistance is at $164.58.
- There is initial support now in the $160.50 area with additional now in the $158 area.
- Volume has declined this week but the OBV (not shown) has made new highs.
NEXT PAGE: 3 Attractive ETFs
|pagebreak|
The iShares MSCI Belgium ETF (EWK) completed its flag formation on April 29 as it closed above the resistance, line c.
- This completed the flag formation (lines c and d) with initial upside targets in the $15.10-$15.30 area.
- The high in 2011 is at $15.65, which is the next long-term target.
- Initial support in the $14.70 area with the breakout in the $14.50 area.
- The daily on-balance volume (OBV) (not shown) has confirmed the upside breakout.
The iShares MSCI United Kingdom (EWU) gapped through resistance at line e, on April 25.
- This completed the recent trading range (lines e and f) that goes back to the early February highs.
- There is next resistance at $19.18 with upside targets from the charts in the $19.50-70.
- The May 2008 high was at $23.61 with an all-time high of $27.38 in October of 2007.
- EWU triggered a daily HCD on April 22.
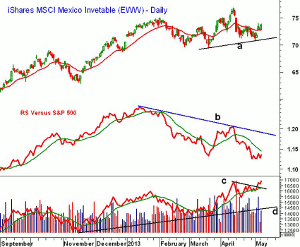
The iShares MSCI Mexico Investable (EWW) hit a high of $76.80 and then dropped to a low of $70.88 on May 1. This was a drop of 7.7% from the highs.
- The close Tuesday was just above the quarterly pivot at $72.87.
- A breakout to new highs would complete the four-month trading range and give upside targets in the $83-$84 area.
- The "title="https://www.moneyshow.com/articles/TEbiwkly08-23452/Spot-Leaders-and-Losers-with-RS-Analysis/">relative performance did not confirm the recent highs, line c, and is still below its WMA.
- The daily OBV broke through its short-term downtrend, line d, and is acting much stronger than prices.
- The OBV has longer-term support at line e.
- There is initial support at $72.60-$73.45 with stronger at $70.88.
What it Means: The increased number of global ETFs and higher liquidity have made the global stock markets an important part of one's portfolio as most "title="https://www.moneyshow.com/articles/GURU-31346/the-week-ahead--Can-Diversification-Ruin-Your-Return/">are not well diversified.
Certainly, following the German Dax over the past year or so was a good guide in determining where the US markets were likely headed.
I am continuing to look for a pullback in some of the overseas ETFs for new buying opportunities but (EWW) looks good now.
How to Profit: For the iShares MSCI Mexico Investable (EWW), go 50% long at $73.42 and 50% long at $72.84, with a stop at $69.83 (risk of approx. 4.5%).


