In volatile markets, it's important to concentrate on price and not to get caught up in wide sentient swings, so MoneyShow's Tom Aspray demonstrates why pivot point analysis is much more reliable, in his opinion, than many other approaches.
Just before the holidays, I wondered Will Volatility Ruin Your Holiday but was not really expecting the markets to get even more volatile in early 2015. The 400 point swing last Tuesday was a sign that this is maybe the new reality for 2015.
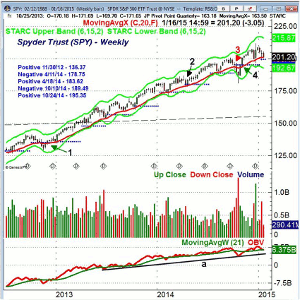
Of course, many believe that only traders make profits in volatile markets, but that is not really the case as many strong bull markets do have wide swings within the overall trend. Many will recall that in 2012 (see chart) there were two double digit corrections but the Spyder Trust (SPY) finished up 16%. The chart also indicates there were also single digit corrections in 2013 that had some investors concerned, even though it was a banner year for the stock market.
The Swiss National Bank roiled the currency markets last week by removing the cap on the Swiss franc/euro exchange rate. This raised the fear level of some investors and also added to the distrust many already have for central bankers. One should remember that the Fed does operate in a much more transparent manner than the SNB.
The huge swings in the foreign exchange markets have added another item to the wall of worry discussed in last week's Another Double Digit Year? Though banks like Deutsche Bank reportedly lost $150 million and several FX dealing firms are likely to be driven out of business leaving their clients unable to access their accounts as one FX firm just got a $300 million loan $150 million and several FX dealing firms may go out of business.
In the long run, I am more concerned about whether those in the eastern European countries who have mortgages in Swiss francs will be able to keep their homes. An increase in the default rate could add further stress to the fragile EuroZone banks.
So, what is an investor to do in such volatile times? The chart I featured last week in Pivotal 1st Quarter Price Levels-along with the publication of the 1st quarter pivot levels-reviewed how the quarterly pivot analysis kept you in the Spyder Trust (SPY) for all of 2013 and most of 2014.
There was a whipsaw last October as SPY closed below its quarterly pivot and then two weeks later closed back above it. This is common with most systematic investing approaches.
The important point is that in volatile markets it is very important to concentrate on the price and not to get caught up in the wide sentient swings that frequently cause investors to change their positions and get out at the wrong time.
Since the pivot levels are based on the prior quarter's high, low, and close, these are hard numbers not economic data points that can be revised in the following months. Having an objective way to make decisions is the best strategy for investors, especially in volatile markets.
The pivot levels clearly alerted one to the decline in the energy sector as I was concerned in October that the crude oil market could hurt stocks. The impact of plunging crude oil prices will be felt for some time.
As for the energy stocks, I will be focusing on how the energy stocks react after their earnings are released. Quite weak earnings are likely to be already factored into their stock prices.
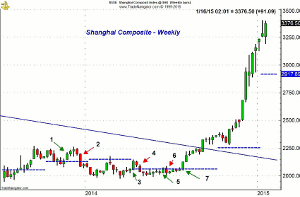
The pivot point analysis is much more reliable, in my opinion, than many other approaches including macro trends analysis. Many who follow this approach have felt for some time that the US market could not go higher when the Chinese economy and their stock market remained weak. Though there are now some signs their economy is improving, their stock market is booming as the Shanghai Composite gained over 50% in 2014.
The Shanghai Composite started the year below the 1st quarter pivot (point 1) and then gave a brief buy signal in April, point 2. This signal was reversed two weeks later as the Shanghai Composite dropped back towards the March lows.
There was another positive signal in June (point 5) that was followed by a sell the next week at point 6. However, the close on Friday, July 25 at 2126 (point 7) was above the quarterly pivot as well as the prior thirteen week highs. Of course, this was the start of the trending move as it closed last week strong at 3376, up over 58% from the July 25 close.
Clearly, signals from the quarter pivot analysis are not infallible and it does require discipline to follow the signals as you do not have an actual stop in the markets. For those who don't have the discipline, or are not willing to review their positions weekly, hard stops may be the best choice.
NEXT PAGE: What to Watch
|pagebreak|
Avoiding large losses is one of the five mistakes that investors should try to avoid in 2015. Longer-term investors may want to consider waiting for two consecutive closes above or below the quarterly pivots before taking action.
The action by the SNB gave gold and the gold miners a solid boost as both had closed above their quarterly pivots the prior week. They recorded nice gains last week, which has now taken the key ETFs back to stronger resistance. This is not a market I feel comfortable chasing at this time, but we should get a better risk entry in the coming weeks.
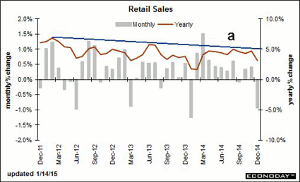
The weaker than expected Retail Sales hit an already vulnerable market last Wednesday as they were down 0.9% in December. This was much weaker than expected with the drop in gas prices. It does not seem consistent to me and to others in light of other data on the consumer. The yearly change is still locked in a trading range and needs a strong move above 5%, line a, to signal a bullish turn.
The University of Michigan's very strong mid-month reading on Consumer Sentiment of 98.2-as well as other recent polls-suggests that the consumer is actually feeling much better about their prospects and the economy. Even Obama's approval rating has gotten a boost. This makes the Retail Sales report difficult to explain and I would expect to see a significant upward revision next month.
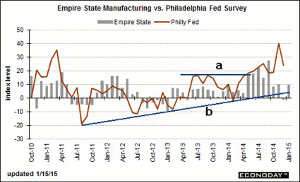
The manufacturing data last week was mixed with the Empire State Manufacturing Survey coming in stronger than expected. In contrast, the Philadelphia Fed Survey came in at 6.3, which was well below the consensus estimate of 20. The chart shows that it had broken out to the upside in 2014 as the resistance at line a, was overcome.
The uptrend from the 2011-2012 lows, line b, is still clearly intact. However, the recent softening of the manufacturing data will bear watching over the next few months. The Philly Fed Survey is a good leading indicator of industrial production, which came in as expected last Friday.
The markets are closed on Monday for the Martin Luther King holiday so the first economic report is Tuesday's Housing Market Index. It should be strong in light of the sharp drop in mortgage rates as should Wednesday's Housing Starts report.
We get a further look at housing on Friday with existing Home Sales and also the Leading Economic Indicators will be released. It is one of the most reliable economic indicators and last week's chart shows how it has always given plenty of advance warning prior to a recession.
What to Watch
Last week may have been a key test for the stock market as the major averages violated their quarterly pivot levels, but most look ready to close the week back above these key levels (see Pivot Table here). The fact that monthly pivot support was also tested does add to the positive scenario. Of course, this does not mean these levels can be broken on a closing basis this week.
A rally from here would be consistent with some of the improvement I see in the short-term outlook for crude as a rally in crude would help support the market. The number of bearish forecasts I felt had reached an extreme and crude oil rallied $2 on Friday.
The continued plunge in global rates, and most importantly, the yield on the 10-Year T-Note yield continues to make many nervous. However, the very low-if not negative-yields do support the bullish case for stocks.
A strong close this week is needed to turn many of the weekly studies higher. The fact that most did confirm the recent market highs is a positive. The daily studies are negative and will take several consecutive strong closes for them to turn the corner and a week or more before they could turn positive.
Of course, the earnings season will also play a role as the negative technical outlook for the big banks last week (Big Banks: Are the Charts Really That Bad?) warned that the earnings reports could add additional selling pressure on these stocks.
The bullish % from AAII rose last week after the prior week's sharp drop. There are now 46.11% bullish and 21.5% bearish. Still too many bulls for my liking.
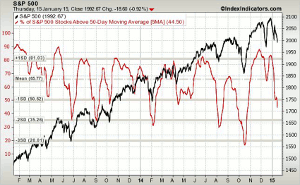
The 5-day MA of the % of S&P 500 stocks above their 50-day MAs has dropped another 10% in the past week down to 44.50% on last Thursday. This is now below the mean and getting closer to the low risk buying zone below 35%.
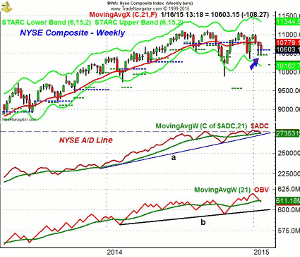
The weekly chart of the NYSE Composite shows that the monthly projected pivot support at 10,456 has been tested over the past two weeks. Heading into the last hour or so of trading, the NYSE is slightly above the quarterly pivot at 10,597. There is additional support at 10,316, which was the December low.
The weekly NYSE Advance/Decline has pulled back from the December 29 high and is now testing its rising WMA. There is longer-term support at line a.
The McClellan oscillator looks ready to close the week below -100 and will take a few days of 3-1 or better A/D numbers to turn positive.
The weekly on-balance volume (OBV) made a significant new high at the end of 2014 but looks ready to close the week below its WMA. With a strong close this week, it could reverse back above its WMA.
The declining 20-day EMA is at 10,699 and a strong close back above 10,809 would be a positive sign.
NEXT PAGE: Stocks
|pagebreak|
S&P 500
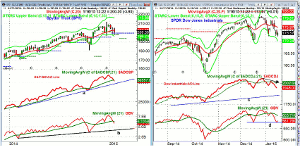
The Spyder Trust (SPY) had a weekly low of $198.55, which was just below the quarterly pivot at $199.42. So far, SPY has held above the monthly projected pivot support (courtesy of John Person's software) at $197.61. The weekly starc- band is at $196.26.
The weekly S&P 500 A/D line has now dropped below its slightly rising WMA. At this point, it is consistent with a pullback as the WMA has not flattened out or turned lower.
The weekly OBV is also below its WMA which does show more signs of flattening out. The daily OBV (not shown) is trying to turn up from the stronger support at the December lows.
The declining 20-day EMA at $203.17 represents first resistance with more important at the January 9 high of $206.42. The daily starc+ band is at $207.28.
Dow Industrials
The daily chart of the SPDR Dow Industrials (DIA) shows that it also tried to stabilize late last week. The low last week at $172.12 was just above the monthly pivot support at $171.93 and the quarterly pivot $171.99. The daily starc- band now stands at $170.25.
The Dow Industrials A/D line dropped below the early January lows and is in a short-term downtrend. It is still holding above the December lows.
The daily OBV did reach the December lows and turned up on Friday. It is still well below its declining 20-day EMA.
Nasdaq 100
The PowerShares QQQ Trust (QQQ) had a low last week of $99.36 which was just below the quarterly pivot at $99.67. The monthly pivot support at $100.02 was violated during the week. The daily starc- band is at $97.87.
The lows last week dropped prices back to the highs from last September, which also corresponds to good support.
The daily chart still suggests a potential trading range but it needs to rally in the next few days to support this view. A breakout above the resistance at line a, in the $105.50-86 area, would project a move to the $111-112 area. The monthly projected pivot resistance is at $108.76.
The Nasdaq 100 A/D line made lower lows last week which is a short-term negative as the support at line c, was broken. The A/D line is now not far above the support from September.
The daily OBV has dropped below the September highs and is now testing the stronger support at line c. The weekly OBV (not shown) did not confirm the late 2014 highs and has also now dropped below its WMA.
Russell 2000
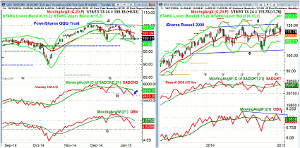
The iShares Russell 2000 Index (IWM) had a low last week of $114.20 which was below its quarterly pivot ($114.73) and monthly projected pivot support ($114.35). In late Friday trading it is at $115.85.
A daily close back above the last week's high at $119.39 would be a strong sign as it would also be above the high from two weeks ago.
The weekly Russell 2000 A/D closed the week back below its rising WMA after making a new high at the end of 2014. It will likely close just below the December lows. The daily A/D line is now in a short-term downtrend.
The weekly OBV has formed lower highs, line f, and is now back below its WMA. The daily OBV is holding up better as it is still above the lows from the middle of December.
NEXT PAGE: Sector Focus, Commodities, and Tom's Outlook
|pagebreak|
Sector Focus
The iShares Dow Jones Transportation (IYT) has tested the lower boundaries of the trading range of the past six weeks as the December low at $153.98 is still holding. The low last week was $154.04 and the sharp afternoon rally has taken IYT well above the quarterly pivot at $156.15.
The weekly relative performance and OBV are both likely to close the week below their WMAs, which are still rising. The daily RS line shows no increase in downside momentum while the OBV has dropped below the December lows.
Most of the Select SectorETFs-except for the Select Sector Utilities (XLU)-did close the week lower. The XLU is still below the December highs.
The Sector Select SPDR Financial (XLF) did close the week below the quarterly pivot. Two of the sector ETFs discussed in Friday's daily column Two Sectors on the Edge rallied sharply Friday.
The Sector Select SPDR Industrials (XLI) and the Sector Select SPDR Technology (XLK) did close the week above their quarterly pivot levels.
The Select Sector Health Care (XLV) and the Select Sector Consumer Staples (XLP) did not give up much ground last week and are still market leading sectors.
The Select Sector Energy (XLE) closed up 2.4% on Friday, but was still lower for the week.
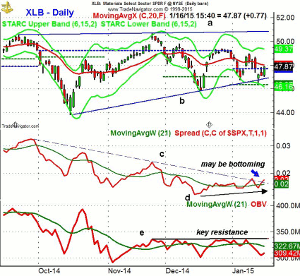
The Select Sector Materials (XLB) bounced late in the week due to the strength in the gold miners. The drop Wednesday came quite close to the monthly projected pivot support. Going into the close, the XLB is just a few cents below its quarterly pivot.
Crude Oil
The March crude oil contract closed up over $2 on Friday after triggering a HCD buy signal on Wednesday.Last week I speculated (Is Barron's $20 Crude Oil Story Bullish?) that the bearish sentiment reflected in many articles-including Barron's-had become too high. The rebound is likely to still go higher as the shorts are squeezed.
Precious Metals
The SPDR Gold Trust (GLD) and Market Vectors Gold Miners (GDX)-as I noted earlier-had a very strong week. It looks as though I should have been more aggressive a few weeks ago as I questioned whether the bottom formations had been completed as I was not convinced.
The Week Ahead
The strong rally in the last two hours Friday was not enough to push the averages into positive territory for the week, but it did improve the short-term technical outlook. The daily studies have turned up but are still in need of a much stronger rally before they could turn positive.
The long-term positives from the technical studies still indicate that this is a correction within the major uptrend. The ECB meeting next week will be the next test as if they start a quantitative easing plan that is strong enough to convince the market, stocks could quickly resume their long-term uptrends.
There is still the potential for stocks to accelerate to the upside in 2015 but no one is expecting that to happen. The bottom line is there are no signs yet of either a major top in the stock market or the start of a new recession. Therefore, I see no reason to change your long-term investment strategy in 2015.
So far, the positive signals from the quarterly analysis are still holding, but it is important that you are in the strong sectors and stocks in those sectors that meet my six point check list for 2015.
On Friday afternoon, I recommended that traders buy the Spyder Trust (SPY). The SPY closed well below the recommended entry, but I will be watching this position closely in case we have a rally failure. Those who are interested should follow my Twitter feed where new recommendations are being made.
In closing, be sure to have a plan and consider using the quarterly pivot analysis to monitor your positions. Do you weekend homework.
Don't forget to read Tom's latest Trading Lesson, 5 Mistakes to Avoid in 2015.

