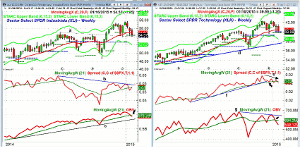
Thursday's surprise action by the Swiss National Bank jolted the markets, so MoneyShow's Tom Aspray examines the weekly technical studies for two of the sector ETFs that are now testing key pivot support levels.
In an already volatile environment, what the stock market didn’t need was the surprise action by the Swiss National Bank (SNB) to remove the cap on the Swiss franc/euro exchange rate. The cap had been in effect since 2011 and the franc rose 30% against the euro in the minutes after the announcement.
As a result of this action, several of the largest foreign exchange firms may go out of business as reports indicate they have negative equity. Larger firms were not immune as of one of Goldman Sachs favorite trades for 2015 was to go short the Swiss franc versus the Swedish krona. After the SNB announcement, they were forced to cover the position for a reported 16.5% loss.
The Swiss Market Index has dropped further in early Friday trading as it is currently down 13% since Tuesday’s close. In comparison, the drop so far this week of 3.7% in the Sector Select SPDR Financial (XLF) or the 4.8% drop in the SPDR KBW Bank ETF (KBE) don’t look so bad.
Of course, the losses in the three big banks stocks I also discussed earlier in the week have seen much more severe losses. Today’s option expiration is likely to add to the stock market’s volatility.
Many of the key stock market averages are now testing key pivot support levels so the close today will be important. The weekly technical studies for two of the key sector ETFs are now giving stronger warning signals suggesting they could be weaker than the S&P 500 in the 1st quarter of 2015.
Chart Analysis: The Sector Select SPDR Industrials (XLI) was up 10.36% in 2014 as it trailed the S&P 500.
- Its largest holdings are General Electric (GE) (9.1%) and Union Pacific (UNP) with 47% in the top ten holdings.
- XLI has declined 5.8% from the early 2015 high of $57.73.
- The chart support connecting the 2014 highs, line a, is now being tested.
- The quarterly pivot is at $54.29 with the monthly projected pivot support at $54.37. The low so far this week is $53.98.
- The weekly RS line is trying to close back above its WMA, which was violated the prior week.
- The relative performance has been diverging from prices as it has formed lower highs, line b.
- The monthly RS analysis (not shown) also has formed a longer-term divergence.
- The weekly OBV looks ready to close this week below its WMA.
- It did confirm the closing high in late December and the monthly OBV is still positive.
- There is initial resistance at $55.57 and the declining 20-day EMA with further at $56.26.
The Sector Select SPDR Technology (XLK) was up 17.85% in 2014 as it outpaced the Spyder Trust (SPY) by over 4%.
- Its largest holdings are Apple Inc. (AAPL) (16.37%) and Microsoft Corp (MSFT) (9.63) with 47% in the top ten holdings.
- There are 71 holdings in the ETF with the top ten making up 57.8% of the portfolio.
- XLK peaked at $42.40 at the end of 2014 and has declined 5.7% from the high.
- The low so far this week is $39.96 which is slightly above the monthly pivot support at $39.85.
- The quarterly pivot is at $40.05 with the weekly starc- band at $38.48.
- The trend line support, line d, is now in the $37.70 area.
- The relative performance peaked in late November and the support at line f, was broken in the middle of December.
- The RS line has formed lower highs (see arrow) since November.
- The monthly RS line (not shown) is well above its WMA.
- The weekly on-balance volume (OBV) made a high in September and formed a lower high in December (line g).
- The OBV dropped below its flat WMA last week but the monthly OBV is positive.
- There is resistance now in the $40.97-$41.62 area.
What it Means: The action in the industrials sector also reflects the recent weakness in the iShares DJ Transportation (IYT), which has been a market leader for most of the bull market. It is on the verge of closing the week below its quarterly pivot at $156.15 (see Quarterly pivot table here).
As for technology, the 10.76% decline in Apple Inc. (AAPL) is clearly dragging this ETF lower.
Crude oil, which I discussed yesterday in Is Barron's $20 Crude Oil Story Bullish?, is higher in early trading and a close above $49.40 in the March contract would be encouraging.


