Having correctly predicted the double digit gains for the S&P 500 in both 2013 and 2014, MoneyShow's Tom Aspray takes a look at the current stock market and economic outlook to let investors know what they should expect in 2015.
The stock market started off the first full week of the New Year with several wide swings which had become more normal in the last quarter of 2014. The weak start for the stock market and the further plunge in crude oil spurred a series of negative opinions on the stock market and the economy.
In a past column, I had featured this quote from Sir John Templeton "Bull-markets are born on pessimism, grow on skepticism, mature on optimism, and die on euphoria." So far, the current bull market has not seen a period of sustained optimism. These periods were part of the secular bull markets of 1949-1968 or 1982-2000, which were accompanied by gains of over 700% and 500%, respectively.
From the 2014 high to the 2009 low, the S&P 500 is up over 200%, which suggests there is still room on the upside. The market’s drop in early 2015 reminded me of previous panic drops as I suggested in last Wednesday’s Bearish Sentiment Creates Buying Opportunity.
To be confident that it was an important low, last week’s lows need to hold and the major averages must breakout to new highs. This is consistent with the A/D line analysis (see What to Watch). Several of the market leading sectors did rally sharply, consistent with a correction low.
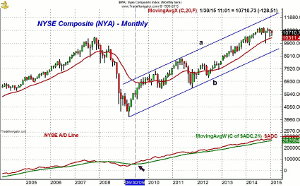
The monthly chart of the NYSE Composite shows a well defined trading channel, lines a and b. The upper channel is currently above 12,000 or 12% above current levels. It will clearly move higher as the year progresses and should be close to 13,000 by yearend. If the NYSE should reach 13,000, it would be a gain of over 20% for the year.
The monthly A/D line moved back above its WMA in June 2009 and has stayed positive ever since. It had dropped below its WMA in December 2007 after forming a negative divergence at the October 2007 highs.
So, what should we expect in 2015? I think that the S&P 500 will have another double digit gain in 2015. This was also my view at the start of 2013 and 2014. There is also the potential for an upward explosion in stock prices. This would be consistent with a much stronger economy and is something few are expecting.
Four years in a row of double digit gains would be unusual as I noted at the end of 2013.
“Three or more years of consecutive double-digit gains in the S&P 500 are quite rare. Since 1975, there has been only one example. From 1995 through 1998, the S&P 500 had gains of 34.1%, 20.2%, 31%, and 26.7%. There were corrections during these years with the most notable being the 22% drop in 1998 before the S&P rallied 33.7% from the October lows to finish the year strong.
Given what I see as the continued improvement in the economy in 2014, I think double-digit gains are again likely in 2014 but the evidence is not nearly as strong as it was last year. I do not expect a smooth ride like 2013 as I think we will see more sharp corrections in 2014.”
A straight line advance like 2013 would be surprising in 2015, but the market generally ends up doing what is least expected. The market is currently concerned about the impact of plunging crude oil prices on the economy. They are equally worried that the ECB won’t act to resuscitate the EuroZone economy or that it won’t be effective.
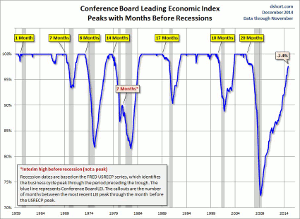
For the past three years, I have consistently dismissed the fears of a new recession and this chart—courtesy of dshort.com—reflects one of the reasons I have not been concerned. It shows that the Conference Board’s Leading Economic Indicator consistently peaks well before the start of a new recession. For example, the LEI peaked ten months ahead of the recession’s start in 2000 and 20 months ahead of it in 2008. The LEI is currently rising strongly.
As for the EuroZone, I am optimistic that the ECB will act and that it will be able to keep them from sinking further into a deflationary trend. Since 2012, I have been warning that austerity was not the answer (Austerity Didn't Work in '37...What About Now?) and I hope Germany in particular will finally get the message.
NEXT PAGE: What to Watch
|pagebreak|
I was concerned about this at the start of 2014, but the market only became concerned in the last few months. These pressures and a flight to safety clearly have been the dominant forces that pushed global interest rates sharply lower in 2014.
This I did not expect as I advised shortening the maturities of one’s bond portfolio in order to be prepared for higher rates. Clearly, I was way too early and did not give the technical evidence enough weight in the spring when yields were in a clear downtrend.
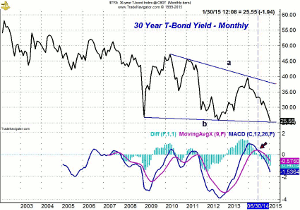
From the 30-Year T-Bond bond yield chart, it is apparent that yields are now testing the lower trend line support in the 2.50% area. They are now close to the 2012 low of 2.45%. A decisive break of this support now looks likely in the first quarter of 2015. The MACD turned negative in June 2014 and it shows no signs yet of turning around. I will be closely monitoring the weekly analysis, which also still favors lower yields.
The better than expected monthly jobs report and upward revisions of the prior two months ended a mixed week of economic data as factory orders did decline for the fourth month in a row. The PMI Services Index also came in weaker than expected but expectations remain strong.
The focus this week will by on Wednesday’s Retail Sales report as last week, strong chain store numbers had the market expecting improving retail sales due, in part, to low gas prices. The Producer Price Index comes out on Thursday along with the Empire State Manufacturing Survey and the Philadelphia Fed Survey.
The Consumer Price Index is out on Friday as is Industrial Production along with the mid-month reading from the University of Michigan on Consumer Sentiment.
What to Watch
The market needed a higher close on Friday to increase the likelihood that the correction was over with last Tuesday’s lows. Though it was apparently discounted by the market on Friday, the jobs report was positive and does bode well for the economy in 2015.
The yearly charts of the stock market do clearly look positive for the year ahead. The break of multiple years of support in crude oil warned of a significant drop as was the case for gold in 2013.
The market is clearly focused on the continued decline in crude oil and the drop under 2% in the 10-Year T-Note yields. Neither seems ready to turn but crude is like an overstretched rubber band as margin liquidation may be the cause of the last $10 drop. It should see a snap back rally this week.
The close this week may resolve the short-term outlook as Friday’s drop is likely to stimulate more bearish sentiment. The correction last week dropped the major averages to, or slightly below their quarterly pivots, but all finished the week above these key levels.
The weekly studies do suggest an eventual upside breakout in the major averages while the daily studies are mixed.
As I noted on Tuesday, the bullish % from AAII dropped 10% last week and a further decline would be a positive for the market.
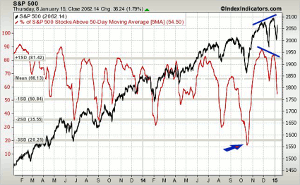
The 5-day MA of the % of S&P 500 stocks above their 50-day MAs has dropped from 82% at the end of 2014 to Thursday’s reading of 54.5%. This is not far above the mean at 50.8%.
The 5-day MA did form a negative divergence, line b, at the recent highs as prices made a higher high, line a. The drop to extreme oversold levels in October (see arrow) is typical, seen at the start of a major move higher, not the final rally in an intermediate-term top.
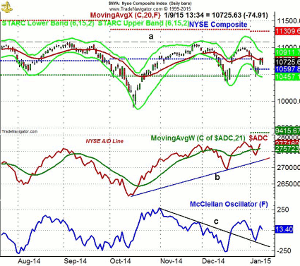
The daily chart of the NYSE Composite shows that in late Friday trading it is still 3.5% below its all time high (line a) . Last week, the NYSE Composite dropped below the quarterly pivot at 10,597 and reached the monthly projected pivot support at 10,456 before turning higher. There is additional support at 10,316, which was the December low.
The daily NYSE Advance/Decline made a new high on December 29 and rose back above its WMA last Thursday. Once Friday’s data is finalized, the A/D line could turn back down. Its WMA is rising slightly, so positive A/D numbers Monday could create a bullish zig-zag formation.
The McClellan oscillator broke its downtrend, line c, after the mid-December lows and it retested the downtrend last week. It may finish the week above the zero line but the action early this week will be important. The ARMS Index closed at an oversold reading of 2.18 last Monday, consistent with a potential selling climax.
NEXT PAGE: Stocks
|pagebreak|
S&P 500
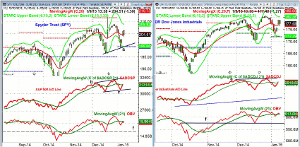
The Spyder Trust (SPY) made it as high as $206.42 in early trading Friday, which was just below the January 2 high before it reversed course. On the decline last week, it dropped slightly below the quarterly pivot at $199.42 as it also violated the dailystarc- band.
The short-term uptrend, line a, is now in this area, with the monthly projected pivot support at $197.61.
The S&P 500 A/D made a significant new high at the end of the year, line b, but dropped back below its WMA on the selling early in the New Year. Some support at line c, with more important at the December low.
The volume increased late in the year as the on-balance volume (OBV) surged well above the highs. It is still holding below its flat WMA.
The daily starc+ band is at $208.76 with further resistance in the $209.50-$210.50 area.
Dow Industrials
The daily chart of the SPDR Dow Industrials (DIA) shows the gap higher last Wednesday after Tuesday’s drop. It is still holding above the 20-day WMA which is trying to turn higher. The quarterly pivot and monthly pivot support in the $191.93-$192.28 area were tested last week.
The Dow Industrials A/D line also shows a pattern of higher highs, line e, and is trying to close the week back above its WMA.
The daily OBV made higher highs last month and is trying to hold just above its WMA. The weekly OBV made a new high with prices in December.
Nasdaq 100
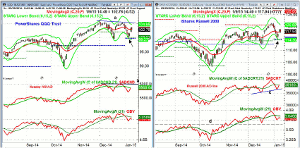
The PowerShares QQQ Trust (QQQ) looks ready to close the week a bit lower as it dropped to test its starc- band on Tuesday. The quarterly pivot at $99.67 and monthly pivot support at $100.02 were also reached.
The daily chart suggests a trading range is being formed and a breakout above the resistance at line a, in the $105.50-86 area will project a move to the $111-112 area. The monthly projected pivot resistance is at $108.76.
The Nasdaq 100 A/D line is also locked in a range but is just below its slightly declining WMA. The daily OBV did make a new high in December as it was acting stronger than prices.
Russell 2000
The iShares Russell 2000 Index (IWM), unlike the QQQ, had an impressive upside breakout in late 2014. It also pulled back to its quarterly pivot ($114.73) and monthly projected pivot support ($114.35) Tuesday before turning higher.
A daily close back above the $120 level should confirm that the correction is over. The monthly projected pivot resistance is at $126.68.
The Russell 2000 A/D did confirm the upside breakout in prices and has rallied back to its WMA at the end of the week. The higher highs in the A/D do look positive.
The daily OBV has pulled back from its highs and closed the week below its WMA. The weekly OBV (not shown) did confirm the upside breakout.
NEXT PAGE: Sector Focus, Commodities, and Tom's Outlook
|pagebreak|
Sector Focus
The iShares Dow Jones Transportation (IYT) has been under pressure in the New Year as the market has apparently concluded that the potential of fewer shipments is more negative than the positives from lower fuel prices. I am not so sure.
The weekly relative performance and OBV analysis do not show any signs of a major top as the weekly OBV is just pulling back to its rising WMA. The daily studies are negative and do not indicate the correction is over quite yet.
The quarterly pivot is at $156.15 with the daily starc- band at $154.64.
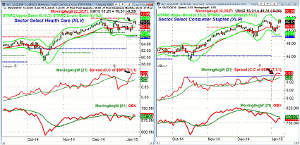
The Select Sector Health Care (XLV) and the Select Sector Consumer Staples (XLP) both gapped higher last Wednesday and closed the week strong.This is characteristic of market leading sectors.
XLV is not far below the December high of $71.17 with the daily starc+ band at $71.56. The low last week at $7.63 was above the December low and well above the quarterly pivot at $66.18. The monthly projected pivot resistance is at $72.98.
The RS line closed at a new high confirming that it is still a market leading sector. The OBV is above its WMA but has not yet made new highs.
The chart of the Select Sector Consumer Staples (XLP) also made a new high last week and could be ready to move sharply higher. The monthly projected pivot resistance is at $50.98.
The Select Sector Utilities (XLU) was up 28.73% in 2014 and clearly was a star performer. It beat out the XLV for just over 2%.
I will have a further look at the key sectors later this week.
Precious Metals
The SPDR Gold Trust (GLD) and Market Vectors Gold Miners (GDX) have held up better in the past two months than I expected after completing their bear flag formations. Both have moved higher as I discussed last week in Gold Rallies: But Is It a Bottom? But I am not convinced they have bottomed.
The Week Ahead
Though the S&P 500 did register a double digit gain in 2014, it was kind of a strange year as there were three V shaped bottoms which are normally more rare. The sentiment numbers are also not as reliable as normal, but once again, the A/D line kept us on the right side of the market.
Quite a few analysts were recommending inverse ETFs near the three correction lows but I was happy not to be one of them. These ETFs had very quick turnarounds and they did not perform as well as one would expect on the market declines. The ARMS Index (TRIN) helped us identify all three of the panic lows, which created low risk buying opportunities.
I see no reason to change your long-term investment strategy in 2015 as the dollar cost averaging positions were meant to be held until the bull market tops out. For those not in the market, I still think that is the best place for your money.
I will be doing a review of the quarterly pivots for the key ETFs next week and will continue to concentrate on stocks in those market leading sectors. I made a couple of new recommendations in some of the Nasdaq 100 stocks that had the strongest relative performance analysis.
If you did put on some light hedges near the early December highs hopefully my comments on Twitter feed helped you in closing them out. Pre-opening recommendations will also be posted on Twitter as sometimes my column does not come out before the opening.
Don't forget to read Tom's latest Trading Lesson, 5 Mistakes to Avoid in 2015.

