
Corrections are usually buying opportunities, so MoneyShow’s Tom Aspray takes a technical look at the charts to see if any of the Nasdaq 100’s most overbought stocks look attractive for purchase.
It was a rough and tumble session Tuesday as the early rally was snuffed out by weak economic data and more selling in the crude oil market. Stocks tried to rally again in the afternoon making it almost into positive territory before the selling resumed.
This may be the early part of the bottoming process as many of the major averages need a strong rally to avoid closing the week below their quarterly pivot levels. The market internals were 2-1 negative which has dropped to the McClellan oscillator to -167.
As I noted in yesterday’s column, the bearish sentiment is increasing as Bill Gross added in his negative view for many asset classes. The further drop in crude oil futures has been accompanied by declining open interest which may be a sign of forced liquidation. The futures are sharply higher in early trading and a close above Monday’s high would be positive.
Click to Enlarge
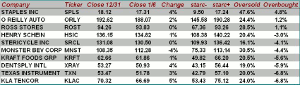
In the monthly starc band scan of the Nasdaq 100 stocks, there were three stocks that closed the month above their starc+ bands. Those most overbought stocks are usually market leaders so corrections are often good buying opportunities.
At the top of this month’s list is Staples, Inc. (SPLS) as it closed December at $18.12 which was 4.8% above the starc+ band at $17.24. On the table I have also included the closing price for January 6 and the % change since the end of 2014. For example, SPLS closed yesterday at $17.31 as it has dropped 4% since the end of December.
Because of the weekly low close doji sell signal in SPLS for two weeks, it is not one of my focus stocks, but there are four stocks that do look attractive for new purchase as they meet my 2015 checklist requirements.
Click to Enlarge
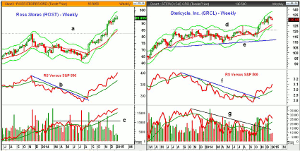
Chart Analysis: Ross Stores (ROST) is a $19.6 billion off-price retailer that was up 26.87% in 2014. It is now 2.45% below its 52-week high.
- ROST surged above the 2013 resistance, line a, in November.
- The rising 20-day EMA is now at $92.10 with further support in the $89-$90 area.
- The quarterly pivot at $88.34 now represents more important support.
- The relative performance broke its nine month downtrend, line b, in early August and completed its bottom formation two weeks later.
- The RS line is still rising strongly and the daily made a new high Tuesday as ROST did close higher.
- The weekly OBV also staged an important breakout last summer as the resistance at line c, was overcome.
- There is minor resistance now in the $95.32-$96.19 area.
- The weekly starc+ band is now at $98.38 with the monthly projected pivot resistance at $100.38.
Stericycle, Inc. (SRCL) is an $11.1 billion specialized waste management company which was up 12.83% in 2014. Most of the gains occurred in the past three months.
- SRCL had been in a broad range, lines d and e, since the summer of 2013.
- The completion of this range has upside targets in the $137-$139 area.
- The weekly starc+ band and monthly projected pivot resistance are in the $138-$138.54 area.
- The weekly relative performance moved back above its WMA in early October and subsequently broke its downtrend, line f.
- The RS line is now in a strong uptrend and well above its rising WMA.
- The daily RS line (not shown) made a new high Tuesday as it closed higher.
- The weekly on-balance volume (OBV) overcame its downtrend, line g, in late October as SRCL was being accumulated.
- There is next support at $127.74 with the monthly projected pivot support at $126.84.
Next: Two More Attractive Stocks to Watch
|pagebreak|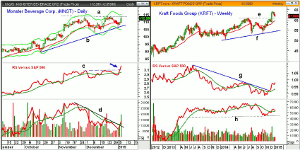
Click to Enlarge
Monster Beverage Corp. (MNST) was up 2.60% on Tuesday after recording a 59.88% gain in 2014.
- The daily chart shows that the upper boundary of the recent trading range, line a, is now being tested.
- The monthly projected pivot resistance is at $118.65.
- The weekly starc+ band is now at $120.48.
- The daily relative performance has just broken out to the upside as the resistance at line c, was overcome.
- The weekly RS line is holding above its WMA, consistent with a market leader.
- The downtrend in the daily OBV, line d, has been broken as volume picked up over the past two days.
- The weekly OBV (not shown) is above its WMA and positive.
- The 20-day EMA was briefly tested last week and is now at $109.53.
- The quarterly pivot and monthly projected pivot support are at $103.80 and $103.19.
Kraft Foods Group (KRFT) tested its weekly starc+ band at the end of 2014 and recorded a yearly gain of 20.22%.
- It is down just over 4% from its 52-week high of $64.47.
- The 20-day EMA is now being tested with the quarterly pivot support at $60.10.
- There is stronger weekly chart support, line e, in the $59.60 area.
- The weekly relative performance turned higher in late November as it broke through its downtrend, line g.
- Both the weekly and daily RS lines are acting strong.
- The weekly OBV has bounced from longer term support, line h.
- The OBV is still well below the previous highs, but the daily OBV is rising very sharply.
- There is initial resistance now at $63.76-$64.
What it Means: All four of these stocks have positive weekly relative performance and OBV analysis. Kraft Foods Group (KRFT) is the closest to first good support, while the correction in Monster Beverage Corp. (MNST) is probably already over.
I would be looking for a pullback to the monthly projected pivot support in Ross Stores (ROST) and Stericycle, Inc. (SRCL) for a buying opportunity.
How to Profit: For Kraft Foods Group (KRFT) go 50% long at $61.64 and 50% long at $60.48 with a stop at $58.85 (risk of 3.6%).
For Monster Beverage Corp. (MNST) traders go 50% long at $111.64 and 50% long at $108.82 with a stop at $105.13 (risk of 4.6%).


