A majority of high profile traders seem to be negative on the big banks as they head into earnings this week, so MoneyShow's Tom Aspray studies the charts to see if a financial ETF and three large banks point to sharply lower prices.
By early Monday afternoon, the negative readings from the market internals pointed to a continuation of last Friday's selling. The declining stocks led the advancing ones by a 2-1 margin as the McClellan oscillator declined further to - 78.5.
Once again, the futures and EuroZone markets are solidly higher an hour before the US opening Tuesday. It is always the close that is the most important and it would take a strong rally to reverse Monday's weakness. The quarterly pivot and next important support for the Spyder Trust (SPY) is at $199.42 with last week's low at $198.85. A close above $206.88 would be positive.
The homebuilders and healthcare stocks held up well in Monday's session but the SPDR S&P Bank ETF (KBE) lost 1.24%. A majority of the high profile traders seem to be negative on the big banks as they head into earnings this week.
According to yesterday's WSJ article, six of the biggest banks "are expected to report fourth-quarter revenue down 9% from a year earlier and per-share profit down 82%, according to analysts' estimates compiled by Thomson Reuters."
These estimates have been declining since the start of the fourth quarter, but do the charts of a financial ETF and three large banks point to sharply lower prices?
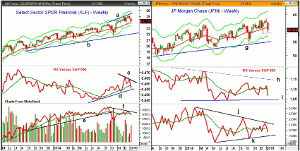
Chart Analysis The Select Sector SPDR Financial ETF (XLF) closed down 0.83% Monday. It has a current yield of 1.61% and gained 15.05% in 2014.
- XLF had a high of $25.14 on December 29 and it is already down 4.8% from its high.
- The quarterly pivot at $23.77 was tested last week with the daily starc- band at $23.49.
- There is weekly chart support, line b, in the $22 area.
- The weekly relative performance formed a negative divergence at the end of 2014, line c.
- This can be observed by comparing the higher highs in price (line a) to the lower highs in the RS (line c).
- The weekly OBV broke a year-long uptrend, line e, in October as the selling was heavy.
- The OBV also formed a bearish divergence, line f, at the recent highs.
- There is key short-term resistance at the swing high of $24.51.
JPMorgan Chase (JPM) reports its earnings before the opening on Wednesday. Since the start of the fourth quarter, the earning's estimates have dropped 7.1%.
- JPM is already close to the December low at $57.74 as it has dropped 6.7% from last month's high.
- The quarterly projected pivot support is at $56.37.
- There is major chart support, line g, at $54.97 with the October low at $54.26.
- The weekly RS line has been in a downtrend, line h, since early 2013.
- The close below the WMA suggests that the RS line could test last summer's lows.
- The weekly on-balance volume (OBV) peaked in early 2014 and has since formed lower highs, line j.
- The OBV has dropped below its WMA with next support at line k.
- The declining 20-day EMA is at $60.53 and was tested last week.
Next: Two More Big Bank Stocks to Watch
|pagebreak|
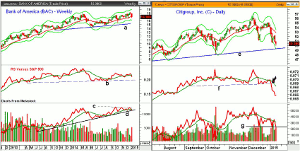
Bank of America (BAC) reports its earnings before the opening on Thursday, January 15.
- A low close doji sell signal was triggered last week when BAC closed below the doji low of $17.68.
- It also closed last Friday below the quarterly pivot at $17.16.
- The daily starc- band is at $16.37 which is just above the quarterly projected pivot support at $16.12.
- On the weekly chart, there is more important weekly support, line c, in the $15.22 area.
- The weekly RS line rallied last summer from the important support at line b.
- In December, the RS line formed lower highs and then closed below its WMA last week.
- The daily RS line (not shown) dropped below its WMA a week ago.
- The weekly OBV has been flat (line c) since last September.
- The OBV is still holding slightly above its long-term support at line d.
- The declining 20-day EMA was tested last Friday and is now at $17.35.
Citigroup, Inc. (C) also reports its earnings before the opening on Thursday, January 15.
The stock broke out in early December and reached a high of $56.95 before it reversed sharply to the downside.
- The six-day decline took it back to the fourth quarter pivot of $50.84 and the daily starc- band.
- The daily chart support, line e, is now at $49.30 with the quarterly projected pivot support at $49.21.
- In October, Citigroup had a low of $48.10.
- The daily relative performance broke four month support, line f, on January 5.
- The weekly RS line (not shown) is below its declining WMA.
- The daily OBV is now testing its recent lows.
- The weekly OBV could close below its WMA this week.
- There is initial resistance at $52, with the declining 20-day EMA at $52.81.
What it Means: The weekly analysis of the Select Sector SPDR Financial ETF (XLF) does favor further weakness, even though it is now close to short-term support.
The negative weekly and daily analysis of JPMorgan Chase (JPM) suggests that the quarterly support at $56.37 will be tested.
Bank of America (BAC) does look the best of these three bank stocks based on the weekly analysis but the daily studies are negative. Nevertheless, we could see some bargain hunting on a decline to the $16-$16.20 area.
Citigroup, Inc. (C) has already dropped 11.5% from its December high and is getting quite oversold. Therefore, it could rally on the earnings as I think the support at $48.10 will hold for now.
How to Profit: No new recommendation.


