The S&P Health Care Sector has been a star performer since it overcame twelve year resistance, so MoneyShow's Tom Aspray examines the charts to see if two healthcare stocks look ready to help push the sector higher in 2015.
Friday's stock market selling helped to further confuse the bulls but likely encouraged some of the bears to stick with their short positions over the weekend. In Friday's The Week Ahead: Another Double Digit Year?, I reviewed the technical studies that pointed to the importance of the stock market's action early this week.
Specifically, clearly positive A/D ratios early Monday afternoon will further validate the rally from last Wednesday's lows. The EuroZone markets are sharply higher in early trading with the Dax Index up over 1.0%. The S&P futures were strong early but have given up some gains as we near the open...
A daily close in the Spyder Trust (SPY) above the January 2 high of $206.88 should set the stage for a move to another all time high. The Sector Select SPDR Health Care (XLV) was one of the strongest sectors on last Wednesday's open as it gapped higher.
The S&P Health Care Sector has been a star performer since it overcame twelve-year resistance in the spring of 2012. It has a three-year annualized return of 28.39% compared to just 19.41% for the S&P 500.
This reinforces the importance of the long-term charts, even the yearly charts as once a long-term support or resistance level is violated, it generally has long-term ramifications. These two healthcare stocks showed up on my weekly scan for bullish relative performance and volume analysis.
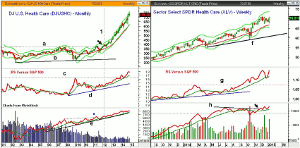
Chart Analysis: The monthly chart of the DJ U.S. Health Care sector (DJUSHC) shows that resistance going back to November 2000, line a, was overcome in March 2012.
- From the March 2012 close at 393, the index has rallied to close 2014 at 725.
- The monthly chart shows that potential doji was formed last month as the starc+ band was tested.
- The monthly relative performance moved back above its WMA a year before the upside breakout
- The RS line has stayed above its WMA every since and overcame the 2008 highs (line c) at the end of 2013.
- The monthly OBV turned positive in July 2008 as it moved above its WMA.
- The OBV only dropped below its WMA in September 2011 but reversed the next month.
- There is weekly support now in the 700-710 area.
The Sector Select SPDR Health Care (XLV) has $13.07 billion in assets with a yield of 1.35%. The expense ratio is low at 0.16% and there are 55 stocks in the portfolio. The largest holding is Johnson & Johnson (11%), followed by Pfizer Inc. (7.7%), and Merck & Co. (6.7%),
- The weekly chart shows that XLV closed last week above the prior two week highs.
- The monthly projected pivot resistance is at $72.98.
- The completion of the daily trading range has upside targets in the $74.50-$75.50 area.
- The relative performance has turned up sharply from its rising WMA, consistent with a market leading ETF.
- The RS line moved through longer term resistance, line g, last September.
- The weekly on-balance volume (OBV) did form lower highs, line h, in September.
- This resistance was overcome in early December and volume was strong last week.
- There is initial support in the $67-$67.63 area with the quarterly pivot at $66.33.
Next: Two More Pharmaceutical Stocks to Watch
|pagebreak|Actavis, Inc. (ACT) is a specialty pharmaceutical company that has a market cap of $71.2 billion.
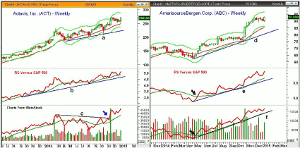
- The strong close last weekly appears to have completed the five week correction from the recent highs.
- The low last week at $253 held well above the monthly pivot support at $249.84.
- The monthly pivot resistance is at $276.91 with the weekly starc+ band at $289.93.
- The quarterly projected pivot resistance is at $310.38.
- The weekly RS line shows a solid uptrend as it tested its WMA two weeks ago.
- The weekly OBV broke through ten month resistance, line c, in November.
- It made another new high last week and is well above its rising WMA.
- ACT closed Friday 2.8% above the 20-day EMA at $261.17.
AmerisourceBergen Corp. (ABC) is a pharmaceutical services company with a market cap of $20.3 billion. It has a yield of 1.07%.
- ABC has been in a tight range of $89.21-$93.27 over the past seven weeks.
- The monthly projected pivot resistance is at $94.34 with the weekly starc+ band at $97.66.
- The weekly relative performance completed its bottom formation in May (see arrow).
- The RS line has been very strong over the past five months and made another new high last week.
- The weekly OBV also bottomed last spring and shows a very solid uptrend, line f.
- Volume increased last week to push the OBV to a new high.
- The 20-day EMA is at $91.13 which is 2% below Friday's close.
- A daily HCD was triggered with last Wednesday's close.
What it Means: These two big healthcare stocks look ready to help push the sector to further new highs in 2015. Both also have positive monthly relative performance and OBV analysis consistent with the Six-Point Checklist for a Profitable 2015.
Would take initial positions on a slight pullback as fairly tight stops under the recent lows can be used.
How to Profit: For Actavis, Inc. (ACT) go 50% long at $268.34 and 50% at $263.04 with a stop at $252.39 (risk of approx. 5%).
For AmerisourceBergen Corp. (ABC) go 50% long at $92.44 and 50% at $91.24 with a stop at $88.16 (risk of approx. 4%)


