

The bigger they are, the harder they…lag? It’s not a perfect expression. But so far in 2026, it’s an accurate one when it comes to the stock market!
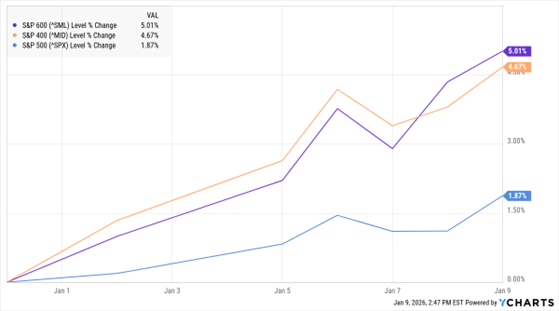
Take a look at today’s MoneyShow Chart of the Day, which shows the year-to-date performance of the S&P 600 Index (^SML), the S&P 400 Index (^MID), and the S&P 500 Index (^SPX). As you might have guessed from the index tickers, the 600 tracks small-cap stocks and the 400 tracks mid-cap stocks. Of course, the market cap-weighted S&P 500 is strongly tilted toward large-cap names.
^SML, ^MID, ^SPX (YTD % Change)
Data by YCharts
As of late last week, the 600 was up around 5%, the 400 was up 4.6%, and the 500 was only up 1.8%. Or in plain English, you’re getting more than twice the return in “SMID” stocks so far than you are in the big behemoths.
Yes, it’s early. But we’ve also seen SMIDs outperform on a one-month and three-month basis. So, this trend has been in place for several weeks, not just several days.
MoneyShow experts like Kenny Polcari and Erin Gibbs of SlateStone Wealth think this will be a big story for 2026 as whole, too. You can get the complete scoop in my MoneyShow MoneyMasters Podcast from last week. But in a nutshell, earnings growth could be stronger in the SMID space – while easier monetary policy from the Federal Reserve could disproportionately benefit smaller companies.
Don’t miss this trend if you’re a trader. Playing it could be the way to greater returns in this young new year!


