
Comparing the monthly, weekly, and daily charts, as we show here for the German stock index, can provide a much more detailed picture than looking at only one of them.
With the European financial situation dominating headlines, traders continue to monitor the strength of Germany’s economy as the strongest in the region.
There’s an interesting chart pattern situation developing on Germany’s DAX index (stock market), so let’s focus on the triple-timeframe picture, which includes a critical support level on the higher frames and a nice positive divergence on the lower frame.
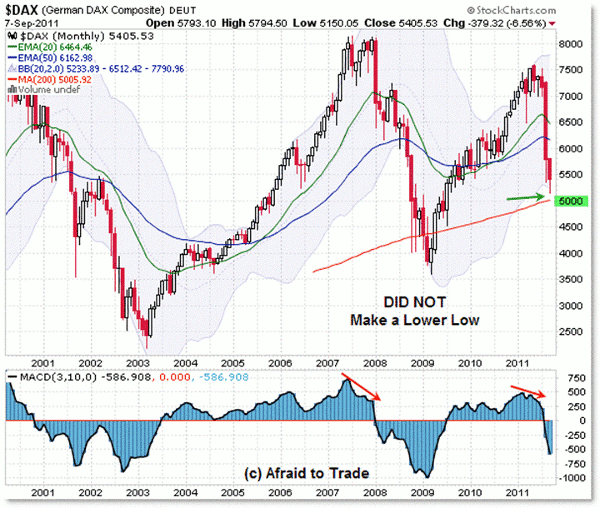
Let’s start with the monthly picture:
Click to Enlarge
Before we get to the current level, I wanted to comment that Germany’s stock market index did not fall to a lower low during the financial crisis of 2008—meanwhile, virtually all other stock market indexes did (including US equity indexes).
Germany’s DAX also did not rally to a new recovery/lifetime high like some of the other global equity indexes in 2011. Still, the movement from the 3,600 level to 7,500 reflects a strong 110% recovery from 2009 to the recent peak in 2011.
On a separate note, I also highlighted the two negative divergences that appeared at the 2007 and 2011 highs, ahead of the reversal in trend.
That being said, the main thing to reference on the monthly chart above is the rising 200-month SMA, which is intersecting the 5,000 index level, along with the lower Bollinger Band at 5,233.
Keep the 5,000 level in mind as we turn now to the weekly chart:
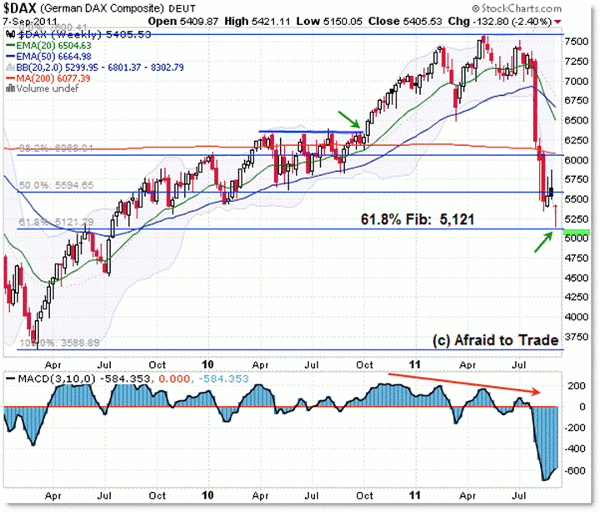
Click to Enlarge
We can see the negative momentum divergence clearer on the weekly frame, as the DAX rallied to the 7,500 level ahead of the trend reversal that occurred into August.
NEXT: What Now?
|pagebreak|What Now?
I drew a simple Fibonacci retracement grid from the 2009 low to the 2011 peak, and the important level to watch now is the 61.8% "final" retracement support at 5,121—or call it "5,100" for easy reference.
So far, the DAX formed a reversal/bullish bar off the monthly and weekly confluence support near 5,000 to 5,100.
Keeping the picture as simple as possible, the buyers hold the ball above 5,000, and should sellers push the index under 5,000, it would likely lead to a further continuation of the down move/downtrend. Otherwise, watch the reaction at current levels.
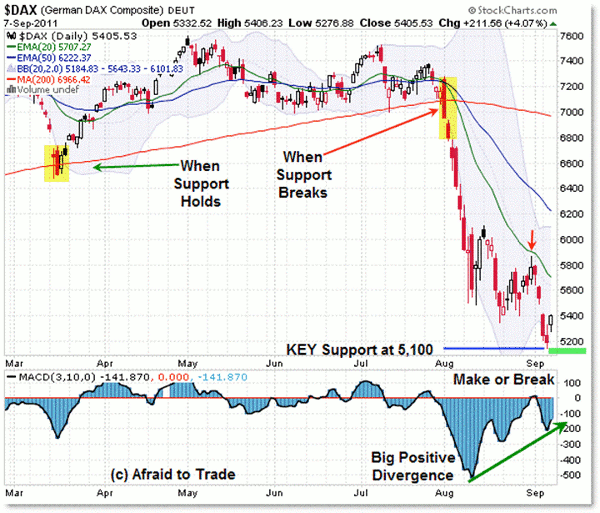
Given the higher timeframe confluence support, the daily chart sports a positive momentum divergence:
Click to Enlarge
The 3/10 Momentum Oscillator is showing a classic positive momentum divergence along with a “Three Push” reversal pattern, as the index scraped the 5,100 level in September.
All things being equal, the classic signal suggests we could be in store for a bullish swing off the confluence support, as suggested by the daily chart divergence and pattern.
Does that guarantee a reversal? Of course not, but from a probability standpoint, it’s late to be bearish (into confluence support) unless the DAX breaks to new lows under 5,000.
Those are your simple parameters which combine the three timeframes on the DAX index. Continue watching the German market at the critical “Make or Break” index pivot.
Corey Rosenbloom is a trader and blogger at AfraidToTrade.com.


