Key market internals like the Advance/Decline (A/D) line suggest that any rallies are likely to fail at overhead resistance, setting the stage for a new wave of selling.
Since the middle of last month (see "Is the Stock Market Still Vulnerable?"), negative technical readings from the market internals have favored a market correction. The stock market's weak close last Thursday prior to the monthly jobs report reinforced this view.
The major stock market averages have now reached the next important support levels, but so far this week, each lower opening has been met with good buying and the market has closed well off that day's lows.
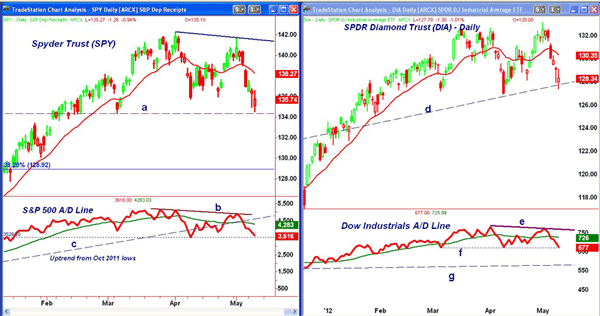
For example, on Tuesday, the Spyder Trust (SPY) traded as low as $134.92 before closing at $136.55. On Wednesday, the low was $134.49, but SPY closed at $135.74. This is a short-term positive and increases the chances that the market is ready for an oversold bounce.
Unless the downtrends in the Advance/Decline (A/D) lines for the major indices are overcome, the rally is likely to set the stage for a further market decline, and it will be important that this week's intraday lows are not broken.
Chart Analysis: The Spyder Trust (SPY) violated the short-term uptrend at $136.22 on Tuesday when the April lows at $135.75 were broken. The early-March lows (line a) in the $134.36 area are still holding.
- There is further chart support at $132.20-$132.50 and then at $130
- Major 38.2% Fibonacci retracement support from the October 2011 lows is at $128.90
- The A/D line slightly exceeded the downtrend from the April high before turning lower. Therefore, a new downtrend, line c, is now evident
- The A/D line is well below its declining weighted moving average (WMA) and the uptrend (line c) from October lows. A rebound in the A/D line should fail at this resistance
- The A/D line is now very close to key support from the April lows
- The chart has first resistance at $136.51 and then at $137.80-$138.27 (the 20-day EMA). The 61.8% Fibonacci retracement resistance is at $139.30
The SPDR Diamonds Trust (DIA), which tracks the Dow, was the only one of the four stock index ETFs to make new highs last Tuesday, but it slightly broke the longer-term support at line c on Wednesday. The April lows are at $126.92, which, if broken on a weekly close, would complete a double-top formation.
- There is further support now at $125 with the major 38.2% Fibonacci retracement support at $122
- The Dow Industrials' A/D line formed a several-week negative divergence, line e, at last week's high
- A significant break in the A/D line below the support at line f will confirm the divergence and indicate a drop to support at line g
- DIA has initial resistance in the $129.50 area with Fibonacci retracement resistance at $130.30-$131
NEXT: Latest Chart Patterns for Nasdaq 100, Russell 2000 Indices
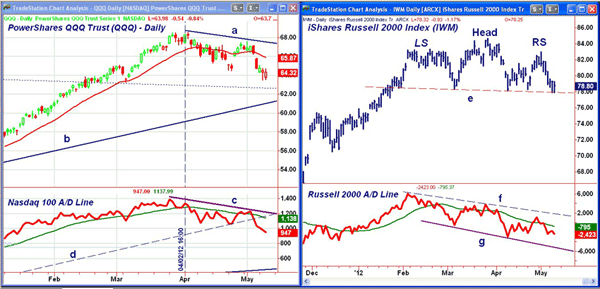
|pagebreak|Also this week, the PowerShares QQQ Trust (QQQ), which tracks the Nasdaq 100, has dropped well below the April lows and come close intraday to the March lows at $63.23. It closed Wednesday down over 6% from the April highs.
- The uptrend from the October lows, line b, and the 38.2% Fibonacci retracement support are in the $61.40-$62 area
- The Nasdaq 100 A/D line formed a slight negative divergence at the April highs that has been confirmed by the break below the recent lows and the uptrend, line c
- The A/D line is now in a short-term downtrend and shows a clear pattern of lower highs and lower lows
- The declining 20-day EMA is now at $65.87 with further resistance at $66-$66.80 and the daily downtrend, line a
The iShares Russell 2000 Index Fund (IWM) still shows a potential head-and-shoulders top formation as the neckline (line e) has been tested over the past two days. A completion of the top would have downside targets in the $71-$72 area.
- The Russell 2000 A/D line has been diverging from prices since it formed a lower high in March, line f. The A/D line needs to move above this downtrend to turn around
- The pattern of lower lows in the A/D line confirms the weakness and suggests that the key chart support will eventually be violated
- There is initial resistance now at $79.50 and stronger resistance at $81-$81.40, where any bounce is likely to fail
- A close above the right shoulder at $83 is needed to turn the chart positive
What It Means: The ability of the major stock index ETFs (and major averages) to close well above the early lows each day this week is consistent with a market that is sold out. The S&P 500 has Fibonacci retracement resistance at 1373-1382 (the 38.2% and 50% levels) with the 61.8% resistance at 1392.20.
As I discussed here last Friday, many of the key inverse ETFs show double-bottom formations that have not yet been completed on a closing basis.
The analysis of the market internals suggests that a rebound from this week's
lows is likely to fail at the Fibonacci retracement resistance which for the
S&P is at 1372-1382. A rally up to this area is likely to set the stage for
a further market decline that could take the S&P below this week's
lows.
If the S&P 500 instead closes decisively below 1340 this week,
then the selling is likely to become much heavier.
How to
Profit: My recommendation for the ProShares Short Russell 2000
ETF (RWM)
was not filled last week. Go 50% long at $26.92 and 50% long at $26.44 with a
stop at $25.48 (risk of approx. 4.6%).
For the ProShares UltraPro
Short QQQ (SQQQ),
go 50% long at $11.66 and 50% long at $11.32 with a stop at $10.68 (risk of
approx. 7%).
Portfolio Update: Buyers should be 50% long
the ProShares Short S&P 500 ETF (SH)
at $36.26 and 50% long at $36.06 with a stop now at $35.92. The stop level was
raised when SH moved above $36.74.
I will be off for the next few days
and the next Charts in Play column will be released on Wednesday, May
16.


