Everybody knows that markets always have a tendency to over-react to news—whether good or bad—and yesterday was no different, so MoneyShow’s Tom Aspray shares tips for weathering the news-cycle chop in your portfolio.
The market’s reaction to Fed Chair Janet Yellen’s off-hand remark seems to have been overdone and the selling carried over to the Asian markets. The Euro markets are down around 1.0% in early trading, but so far, the futures are not down as much.
This was not the “smackdown” I was concerned about in yesterday’s column but it does make the action in the last two days of this week more important. If the market can close higher either today or tomorrow, and especially above Tuesday’s close, it should keep the short-term momentum positive. The S&P 500 closed Tuesday at 1872.25 and the Spyder Trust (SPY) at $187.91 so these are the upside levels to watch. On the downside, a close below 1820 in the S&P 500 or $182 in the Spyder Trust (SPY) would be consistent with a sharper decline.
In my opinion, as well as that of many others, there was not anything surprising in the FOMC announcement and nothing that was overly negative for the stock market. Clearly, the market does not care about any opinions, and therefore, I will be watching the market internals closely.
One cannot really “Fed proof” one's portfolio and what I do with the Charts in Play portfolio is to look at each position individually. For those positions that were recently added, I tend to stay with the original stop unless something has drastically changed. The stops for other positions are determined by chart and pivot support, as well as money management concerns.
Even though it has been less than a week since I last reviewed the portfolio in Is Your Portfolio Well-Positioned?, I felt that now was the time to make further adjustments.
Let’s look at the market after yesterday’s action, as well as some of the current portfolio positions.
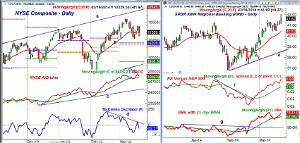
Chart Analysis: The NYSE Composite shows yesterday’s wide range as the close at 10,359 was above the day’s low at 10,306.
- On the chart the monthly pivot, line b, is at 10,209 with more important support in the 9900-10,000 area.
- The NYSE Advance/Decline turned lower Wednesday after Tuesday’s new high.
- The A/D line is still above its rising WMA and a drop below last Thursday’s low would be negative.
- The McClellan oscillator has reversed to -52 and is back below the zero line.
- If it can move back above the zero line in the next few days a bullish pattern would be formed.
- There is key short-term resistance in the 10,450 area.
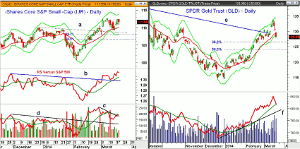
The SPDR KBW Regional Banking ETF (KRE) was actually up 0.65% on Wednesday, but closed well below the day’s highs. It was recommended in the February 25th column (see arrow).
- There is minor support in the $41 area with the rising 20-day EMA at $40.42.
- The quarterly pivot is at $38.83 and may rise to the $40 area in the 2nd quarter.
- The relative performance rose sharply yesterday as it broke its downtrend on February 24.
- The RS line is well above its rising WMA and the weekly (not shown) is also positive.
- The daily OBV is close to making new highs as it bounced off the rising WMA last week.
- The OBV moved through strong resistance, line g, in February.
- The weekly starc+ band is at $42.72 with the monthly in April at $45.01.
NEXT PAGE: 2 More Positions Reevaluated
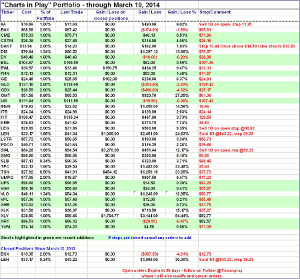
|pagebreak|The iShares Core S&P Small Cap (IJR), which tracks the S&P 600 tested its 20-day EMA during last week’s pullback.
- The 20-day EMA is $110.12 with last week’s low at $109.20.
- The 38.2% Fibonacci support from the February low of $100.73 is at $108.07.
- The 50% retracement support is at $106.65 with the quarterly pivot currently at $105.19. It will rise to the $108 level in April.
- The relative performance broke through its resistance, line b, in late February.
- The RS line retested the breakout level and its rising WMA last week.
- The daily on-balance volume (OBV) broke its short-term downtrend, line c, last week.
- The OBV is still just below its WMA but did stage a major breakout (line d) last month.
- The weekly OBV (not shown) is positive as it is above its WMA.
- The daily starc+ band is at $113.67 with the weekly at $115.38.
The SPDR Gold Trust (GLD) has had a rough week after peaking at $133.69 last week when the daily starc+ band was tested.
- The close Wednesday was below the rising 20-day EMA at $129.10.
- In an uptrend, this is normally a good level of support so the next few days will be important.
- There is further support at $127 with the monthly pivot at $125.82.
- The daily OBV did make a strong new high with prices and has now pulled back to its rising WMA.
- There is further OBV support at the uptrend, line f.
- The weekly OBV (not shown) does indicate that an important low is in place as it is well above its WMA.
- There is initial resistance at $131-$132 but a close above $133.30 is needed to suggest the correction is over.
What It Means: The close this Friday is likely to clarify the market’s short-term outlook and give us a good idea whether the market is going to move to new highs or drop below last week’s lows.
The regional banks are likely to benefit from higher rates, and I recommended First Horizon National (FHN) in yesterday’s tweet and Western Alliance Bancorporation (WAL) before the opening today. This regional bank is part of the focus in this week’s trading lesson and to get a free copy this afternoon, sign up here.
There is also a bullish case to be made for small-cap stocks as they are less overbought than the large-cap S&P 500 and technically look stronger.
The current long positions in the SPDR Gold Trust (GLD) and Market Vectors Gold Miners (GDX) are very close to being stopped out. If they are, I will look for a new entry point as the weekly analysis does suggest a bottom is in place.
How to Profit: I would go 50% long Western Alliance Bancorporation (WAL) at $23.84 and 50% long at $23.24, with a stop at stop $22.39 (risk of 4.8%).
Editor’s Note: The next Charts in Play column will be released on March 31.
NEXT PAGE: The Charts in Play Portfolio
|pagebreak|


