Mixed signals from economic data continue to fuel the sideways choppy moves in the markets as MoneyShow's Tom Aspray examines the charts for clues on what might come next.
Global concerns over the health of the economy in addition to a cautious comment from a well-known hedge fund manager combined to push stocks sharply lower Thursday. Yields continued to drop as the yield on the 10-year T-note fell below 2.50% during the day.
The Spyder Trust (SPY) is already down 1.5% from Tuesday's doji high but is still above the month's low at $186. A weekly close below this level is likely to add more downward pressure on stock prices. As I said last Friday, "A weekly close in the 10-year yields below 2.47%" will be a sign that yields can still move lower. Such a close would also mean that my analysis of the bond market was wrong.
The Housing Starts and initial survey on consumer sentiment from the University of Michigan both out later today could move the market.
There are some stocks that appear to be having just a normal pullback while others look pretty ugly. The small-cap iShares Russell 2000 (IWM) dropped to sharp new correction lows, Thursday, but then rebounded to close near the day's highs. A higher close in IWM, Friday, is needed to suggest that ii may have formed a short-term low.
Should investors be worried that stocks will drop to new lows for the year? How the key markets close on a weekly basis should help us determine the best strategy for the weeks ahead.
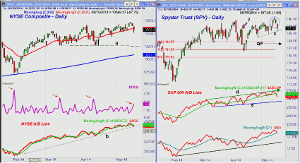
Chart Analysis: The daily chart of the NYSE Composite shows that it closed just below its 20-day EMA on Thursday. The monthly pivot at 10,522 was tested at the day's low.
- There is monthly projected pivot support at 10,375.
- There is more important support at line a and this also corresponds to the quarterly pivot at 10,270.
- The rising 200-day MA is considerably lower at 10,080.
- The Arms Index was at 2.66 at the market's low but closed at 1.78.
- At the April lows, it hit 2.37 and was a bit higher at 2.48 when the SPY made its low in March.
- Of course, it was very oversold in early February at 3.42.
- The NYSE Advance/Decline did make a new high Monday but is now back below its WMA.
- The uptrend from the February and April lows, line b, is now being tested.
- Another day of sharply negative A/D ratios could start a new downtrend.
- The McClellan oscillator (not shown) has dropped to the -104 level.
The daily chart of the Spyder Trust (SPY) shows that a low close doji sell signal was triggered on Wednesday.
- The short-term support, line c, was tested on Thursday.
- A daily close below the May 7 low of 186.01 will increase the odds of a drop to the minor 38.2% Fibonacci support at $183.75.
- The quarterly pivot is at $182.70 with the 50% support at $181.69.
- The S&P 500 A/D shows a longer-term pattern of higher highs, line d.
- It made a new high on Monday but has now dropped below its WMA and the recent lows.
- The WMA is starting to flatten out but is not yet declining.
- The A/D line has much more important support from March and April at line e.
- The daily on-balance volume (OBV) made a new high on Tuesday and has now dropped back to its WMA.
- Prior to the sharp drop in early April, the daily OBV was already diverging from prices.
- The weekly OBV (not shown) may drop below its WMA this week.
What It Means: The market's downside reversal after breaking out to the upside has increased the bearish sentiment amongst traders. At this point, the worst-case scenario is that the SPY will drop back to the lower boundary of its trading range in the $182 area. That would push the market internals into very oversold territory and increase the bearish sentiment to very high levels.
To set up this sort of drop any short term rally should fail by early next week. This would be similar to what happened on April 8-10 (see arrow point 1 on SPY chart). If instead the market closes higher, Friday, and can add to the gains early next week, then a challenge of this week's all-time highs is likely.
For the PowerShares QQQ Trust (QQQ) there is important daily chart support now at $85.50.
In terms of strategy, be sure to have your stops in place and keep your risk low on any new positions.
How to Profit: No new recommendations


