December may offer more headaches in what has already been a frustrating year for many investors, so MoneyShow’s Tom Aspray reviews the monthly technical scans of four markets he feels will be the most important this month.
It seems as though the markets were hit with a double whammy over the Thanksgiving Day holiday and this may have an impact on stocks for the entire month. The failure of OPEC to cut production was expected, not only because of the comments prior to the meeting, but also the charts, as I noted on November 5 in Two Worst Markets in Any Time Frame.
The preliminary news of an 11% drop in the Black Friday sales also is disappointing the markets, but in the past, these numbers change in reaction to cyber Monday and other retail benchmarks. Therefore, the verdict may still be out on the prospects for the retailers.
After what has been a frustrating year for many investors, the last month of the year may give them more headaches, even though December is typically a good month for stocks. Since 1950, the S&P 500 has been up 49 years and down just 15. The average gain has been 1.62%. With the S&P 500’s monthly close at 2067.56, the average gain would mean a 2014 close at 2100.
The markets are reacting negatively to the continued drop in crude oil as the January contract dropped below $64 in early trading, which is almost $10 below last Wednesday’s close. The Euro markets are down around 0.50% in early trading while the S&P futures are 16 points lower.
In reviewing the monthly technical scans, including the A/D data, volume, and relative performance, there are four markets that I feel will be the most important in December and may also have important implications for 2015.
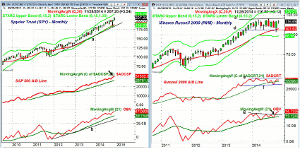
Chart Analysis: The S&P 500, or the widely followed Spyder Trust (SPY), is the most common benchmarks for both the professional money manager and the individual investor. Many fund managers will need a strong performance in December in order to catch up with the S&P.
- The monthly chart reveals that, so far in 2014, there have only been three lower monthly closes.
- The 20-month EMA was exceeded in October, and prior to that, has not been tested since 2012.
- For December, the monthly pivot is at $205.42 with projected support at $202.22.
- The monthly projected pivot resistance is at $212.85, while the monthly starc+ band is at $216.79.
- The monthly A/D line made another new high in November, a bullish sign for the intermediate-term.
- The monthly on-balance volume (OBV) has also confirmed the price action.
- The weekly OBV has not confirmed the recent highs.
- The daily chart has short-term support now at $20.42 with more important at $200-$202.
The iShares Russell 2000 (IWM) shows a broad monthly trading range, lines c and d, that has been in effect for most of 2014. It was broken briefly in mid-October. Is this a top formation or a continuation pattern?
- If you take my view that the economy will improve even further in 2015, then the small-cap stocks should breakout of this formation to the upside.
- The IWM did form a doji in November and is testing the monthly pivot at $116.61.
- The monthly projected pivot support is at $114.68.
- Of course, the January effect, which I will discuss later in the week, also favors the small-caps between now and January.
- The Russell 2000 A/D line peaked in February and then formed slightly lower highs in June (line e) as the new highs were not confirmed (see arrow).
- The A/D line is currently well above its WMA with key support at line f.
- The weekly and daily A/D lines did not make new highs last week.
- The weekly OBV did breakout to the upside last week as resistance, at line g, was overcome.
- There is daily chart support at $114.37.
NEXT PAGE: Two More Market ETFs to Watch
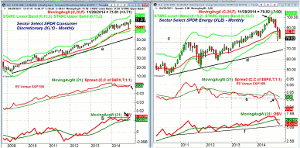
|pagebreak|The Sector Select SPDR Consumer Discretionary (XLY) closed the month at a new all time high. The improvement in the employment situation and in the economy would be expected to lead to greater consumer spending this month and in 2015.
- Last week’s reading on both Consumer Confidence and Consumer Sentiment were weaker than expected.
- There have been a number of retail stocks that have done well, but also quite a few that have dropped sharply on their earnings.
- The monthly relative performance closed back above its WMA in December.
- The weekly RS line (not shown) is positive but has not confirmed the new highs.
- The monthly OBV broke out to new highs last month as the resistance, at line b, has been overcome.
- The weekly OBV has not yet moved above its WMA, which is a short-term concern. It has key support at the October lows.
- The monthly pivot is at $70.23 with the daily 20-day EMA at $69.02.
- The monthly projected pivot support is at $68.51.
- The daily technical studies look very strong.
The Sector Select SPDR Energy (XLE) shows the monthly close on the starc- band. The plunge last week was just part of the decline after the starc+ band was tested in June. The crude oil market is clearly oversold short-term and the bearish sentiment is high, so a bounce is likely in the next week.
- The energy stocks are important to the health of the overall economy so a bottom in this sector by February will be important to the overall health of the economy.
- The sharp decline in gas prices will continue to help the consumer, so it is a double-edged sword.
- The weekly support noted last week at $85 and the monthly projected pivot support at $80.70 have both been violated.
- The long-term monthly chart shows next major support in the $75-$76 area.
- The long-term uptrend, line d, is now in the $68-$70 area.
- The deterioration in the monthly relative performance warned of the sharp several-month plunge.
- The RS dropped below its WMA in August and then the long-term support, line e, the following month.
- The monthly OBV did confirm the June highs, but is now well below its flattening WMA.
- The monthly OBV has long-term support at line f.
- The weekly OBV (not shown) has not yet made new lows for the year.
- The monthly projected pivot support is at $73.23.
What it Means: Just as the small-cap indices gave an important warning before the October plunge, they will need to be watched closely on a further correction this month. It will still be important for the bullish case and to support the January effect that they show better relative performance.
If the crude oil price stays below $70 for too long, it will start to further curb oil exploration in the US, which will have an economic impact.
By the middle of the week, we should see some stabilization in the US stock market ahead of the monthly jobs report Friday. It should be an interesting week.
How to Profit: No new recommendation.


