A number of columnists have pointed out that the lowest rated stocks often do the best, so MoneyShow’s Tom Aspray studies the monthly and weekly charts of the “most hated stocks of 2015” to see which actually look the most attractive.
Stocks closed strong last week despite the widespread low expectations that investors have regarding this earning’s season. The fact that the weekly and daily NYSE A/D lines are leading prices higher (see chart) is bullish as it typically will be followed by the major averages also making new highs.
The S&P futures are lower before the opening as the Spyder Trust (SPY) needs a close above $211.50, or so, to make those on the short side nervous. The S&P 500 A/D line did make a new high last week, which is a positive sign.
As was evident from last week’s winners and losers, it still may be a very treacherous earnings season as often times when stocks miss expectations the selling is brutal. Of course, trading or investing in individual stocks gives you the potential for a greater reward if you are willing to accept the higher risk.
Most stock market veterans realize that the primarily fundamental Wall Street equity analysts of the largest firms do not have a good record of picking winners and losers. Some may have noticed that, frequently, when a stock suddenly drops 10-15%, the rating is then changed from Buy to Hold.
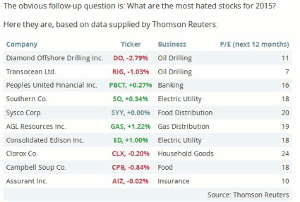
A number of columnists have pointed out the fact that the lowest rated stocks actually often do the best. Early in the year, this was the focus of a Market Watch column by Brett Arrends as he had Thomson-Reuters put together the above table of the “most hated stocks for 2015.”
In looking at the monthly and weekly charts of these ten stocks, four had the best charts and technical studies.
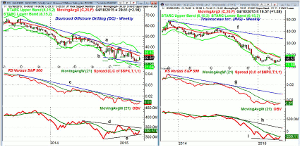
Chart Analysis: Diamond Offshore Drilling (DO) is a $4.06 billion oil and gas drilling & exploration company with a yield of 1.69%. It was down 2.8% on Friday and is down -19% YTD. It reports on May 4.
- The weekly chart shows a well established downtrend, line a, going back to July 2013.
- Five weeks ago, DO made lower lows, line b, as it dropped to $26.02.
- There is trendline support now in the $24 area with monthly support at $22.98.
- The declining 20-week EMA is at $31.71 with the prior swing high at $37.43.
- The relative performance has turned up, but is still below its WMA and the resistance at line c.
- The daily RS line (not shown) is above its now rising WMA.
- The weekly on-balance volume (OBV) formed a positive divergence at the recent lows, line e.
- A strong move above the resistance at line d, is needed to confirm this divergence.
- The 20-day EMA and initial support is at $28.51 with the daily starc- band at $26.92.
Transocean Inc. (RIG) is a $6.0 billion provider of offshore contract drilling with a whopping yield of 19%. On the surface, it would seem ripe for a dividend cut, but has a current ratio of 1.59, which is consistent with short-term financial strength. It reports in early May.
- RIG is down 5.51% YTD after losing 15.88% in 2014.
- After a low of $13.28 the week of March 20, it has rallied 24.7%.
- The 20-week EMA is at $17.99 with the 2015 high of $19.84.
- The weekly downtrend, line f, is now in the $34 area.
- The weekly RS line just barely closed above its WMA last week.
- As per my stock picking guidelines, the RS line needs to close above the December high (see arrow) to signal that it is a market leader.
- The daily RS analysis (not shown) does appear to have completed a bottom.
- The weekly OBV has made lower lows (line f) and is still slightly below its WMA.
- The 20-day EMA is now at $15.57 which is 6% below Friday’s close.
Next: Two More Most Hated Stocks to Watch
|pagebreak|
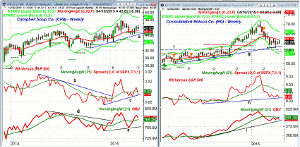
Campbell Soup Co. (CPB) has a market cap of $14.3 billion with a yield of 2.72%. It is up 5.55% YTD and beating the S&P 500, so far, this year. It had a 4.55% gain in 2014 and does not report until May 22.
- The 20-week EMA is now at $45.23 with the monthly pivot support at $44.09.
- The weekly chart shows the uptrend, line a, from the 2014 low is also in the $44 area.
- The weekly relative performance broke its downtrend, line b, in early January.
- The RS line has dropped back below its WMA with next support at line c.
- The weekly OBV also had an upside breakout, line d, late last year.
- The OBV has turned down but is still above its WMA and support at line e.
- The daily close above the early April high at $46.77 will reassert the uptrend.
- The daily starc- band is now at $44.83.
Consolidated Edison Co. (ED) is one of the two utilities on the list. ED has a market cap of $17.8 billion with a yield of 4.17%. It is down 6.82% YTD after an impressive gain of 23.97% in 2014. They also report in early May.
- The weekly chart shows that ED tested long-term support, line g, just three weeks ago.
- Once below the recent low at $58.65, there is further support in the $57 area, line f, which should be a low risk buying area.
- The weekly relative performance has also reached long-term support at line h.
- The daily RS line (not shown) needs to move the early April highs to complete a bottom formation.
- The weekly OBV has declined steadily from the January highs.
- The OBV is below its WMA but still above long-term support at line i.
- There is short-term resistance now in the $62 area.
What it Means: Campbell Soup Co. (CPB) looks the best technically but requires a pullback to setup a decent risk/reward buying opportunity. My second favorite is Diamond Offshore Drilling (DO), which looks attractive, but only at much lower levels. If the weekly studies turn firmly positive and the OBV divergence is confirmed that would be more impressive.
Though Transocean Inc. (RIG) has likely also bottomed, I do not see a good opportunity unless we see a sharper correction and the very high yield makes me nervous.
How to Profit: For Campbell Soup Co. (CPB) go 50% long at $45.32 and 50% at $44.74 with a stop at $42.93 (risk of approx. 4.6%).
For Diamond Offshore Drilling (DO) go 50% long at $28.42 and 50% at $27.04 with a stop at $26.36 (risk of approx. 4.9%).


