
This leading semiconductor chip maker’s stock dropped sharply in March and many other semiconductors dropped with it, so MoneyShow’s Tom Aspray takes to the charts to see if this has changed the weekly outlook for this important industry group.
It was a sluggish day for stocks Monday as even though the Nasdaq Composite was able to move above 5000 during the day, it closed lower. The small-caps and banks were a bit higher while the oil & gas stocks were hit with profit taking as they had become overextended last week.
Another day or so on the downside would not be surprising but it is the weekly close that will be more important. The new highs in the NYSE Advance/Decline line continues to favor an upside breakout from the recent trading range.
The market now faces the early earnings test with JP MorganChase (JPM), Wells Fargo & Co. (WFC), and Johnson & Johnson (JNJ) all reporting before the opening. In early trading, both JPM and WFC are higher while the futures are a bit lower.
More important for the technology sector could be the earnings report after the close for Intel Corp. (INTC) as the stock has had a rough year losing 11.90% YTD. The Market Vectors Semiconductor (SMH) has just kept pace with the Spyder Trust (SPY) as it is up 2.23% YTD.
Intel dropped sharply in March as they revised their outlook for the 1st quarter based on weak demand for business desktop PCs. They are expected to issue revised guidance with today’s 1st quarter earnings. Many of the other semiconductors also dropped with Intel, but has this changed the weekly outlook for this important industry group?
Click to Enlarge
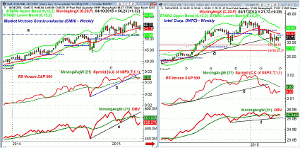
Chart Analysis: The Market Vectors Semiconductor ETF (SMH) closed above weekly resistance in the middle of February and continued higher for the next three weeks.
SMH hit a high of $58.47 before it stalled and then dropped sharply with Intel, which is an 18.8% holding in SMH.
- The sharp low at $52.62 was below the pre-breakout low from February at $52.93.
- There is further support at $52.20, line a.
- SMH closed back above its 20-week EMA last week with next resistance at $57.88.
- The weekly starc+ band is now at $60.69 with monthly pivot resistance at $61.81.
- The relative performance broke its uptrend, line b, on the recent correction.
- The RS has turned up but is still below its WMA.
- The weekly OBV also violated its support, line c, and is now below its declining WMA.
- The daily studies are just slightly positive heading into earnings.
Intel Corp. (INTC) broke the uptrend from the early 2014 lows, line d, on the March drop.
- The March low at $29.31 was just above the 50% retracement support at $29.15.
- The weekly starc+ band is at $27.89 with the 61.8% support at $27.17.
- The weekly RS line dropped below its WMA at the end of January.
- The longer-term uptrend, line e, was broken well before their surprising announcement.
- The OBV held its support, line f, on the correction and closed last week barely above its WMA.
- A drop below this support would be an intermediate-term negative.
- The daily studies suggest that the recent rally is just a bounce in the downtrend.
- The quarterly pivot is at $32.60 .The 20-day EMA is at $31.40 and is now trying to turn higher.
Next: Two More Semiconductor Stocks to Watch
|pagebreak|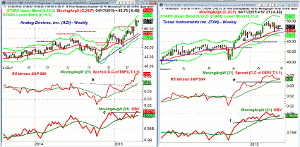
Click to Enlarge
Analog Devices, Inc. (ADI) was a recommendation from January 22 as the buy levels were hit on the early February drop to $50.95. It is up 15.54% YTD.
- The weekly starc+ band was hit two weeks ago.
- Once above the high at $64.94, the weekly starc+ band is at $67.34.
- The quarterly pivot resistance is at $73.62.
- The weekly relative performance resistance at line b, was overcome one week after the February lows.
- The RS line is still rising sharply as it continues to be a market leader.
- The breakout in the weekly OBV has been less impressive as it has just barely made it above resistance at line c.
- The OBV is well above its slightly rising WMA.
- There is initial support at $61.70 and the rising 20-day EMA.
- The 20-week EMA is rising strongly and now sits at $57.68.
Texas Instruments Inc. (TXN) peaked in early March at $59.99 but has drifted lower over the past five weeks.
- So far, the quarterly pivot at $56.19 has held on a weekly closing basis.
- The 20-week EMA was tested a few weeks ago and is now at $55.49.
- The RS line broke through resistance, line e, in early February.
- The relative performance is now testing its still rising WMA.
- The weekly OBV is now slightly below its WMA but it did confirm the recent highs.
- The daily studies are mixed with just the OBV now positive.
- There is minor resistance now at $58.60 but TXN closed below its 20-day EMA on Monday.
What it Means: Overall, the rally in the semiconductor sector has been disappointing though there have been some bright spots like Analog Devices, Inc. (ADI). The technical outlook for Intel Corp. (INTC) does not favor new buying though it could still have a positive surprise.
The decline in Market Vectors Semiconductor ETF (SMH) just barely hit the stop that had been raised as the rally was not strong enough to hit my initial profit taking zone. The positive longer-term outlook for the industry group does keep the semi stocks on my prospective buy list.
How to Profit: No new recommendation.
Portfolio Update: For the Market Vectors Semiconductor (SMH), the 100% long from $53.79 was stopped out at $52.85.
For Analog Devices (ADI) was 100% long at $52.49 and sold 1/3 at $62.58 or better. Use a stop now at $59.33.
For Texas Instruments Inc. (TXN) should be 100% long at an average price of $55.12. Sell ½ at $57.10 or better and use a stop at $55.26 on the remaining position.


