The sharp gains in this tech ETF and monster stock are signs the entire sector may be ready to again lead the market higher, so MoneyShow’s Tom Aspray uses multiple time frame technical analysis to determine if now is the time to buy.
The stock market on Monday was quite impressive as the advancing stocks led the declining ones by over a 2-1 margin. The 1.69% gain in the Dow Transports and the 1.51% rally in the Nasdaq 100 was an encouraging sign after Friday’s market plunge.
One CNBC analyst remarked on Monday that the rally was in sharp contrast to those on Friday’s closing panel who seemed to be warning about the “end of the world.” I argued in Friday’s Fakeout or Breakout? that the new high last week in the NYSE A/D does favor a broadly based move to new highs in the major averages.
The strong close Monday was not enough to confirm an imminent breakout, but another strong close Tuesday would add more weight to the bullish case. The S&P futures are higher in early trading as are the EuroZone markets.
The sharp gain in the PowerShares QQQ Trust (QQQ) and the 2.28% rise in Apple, Inc. (AAPL) is a sign that the technology sector may be ready to again lead the market higher. The daily technical studies for Apple, Inc. (AAPL) now are very close to giving new buy signals
The current corrective pattern in Apple, Inc. (AAPL) is similar in many respects to what I saw in January where I advised buying Apple on a pullback ahead of their earnings. They report earnings next Monday and the stock is higher in pre-opening trade and the multiple time frame charts explain the current strategy.
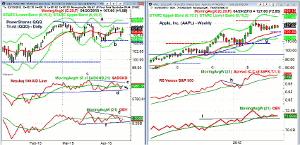
Chart Analysis: The PowerShares QQQ Trust (QQQ) has next resistance at last week’s high of $108.38.
- A strong close above $109.20 (line a) will be an upside breakout with monthly pivot resistance at $111.27.
- The upside targets from the trading range and the quarterly projected pivot resistance are at $114.67.
- The Nasdaq 100 A/D line has moved back above its WMA with key resistance at line c.
- The daily OBV has turned up from support at line f, but is still below its WMA.
- A break in the OBV downtrend, line e, would be positive.
- There is short-term support at $106.34 and the monthly pivot.
The weekly chart of Apple, Inc. shows that this is the eighth week since AAPL made its February high at $133.60.
- The quarterly pivot was tested in February.
- The decline from the November 2014 high to the January low also lasted eight weeks.
- Now AAPL needs a weekly close above $129.60 to confirm that the correction is over.
- The weekly starc+ band is at $137.44 with the 2nd quarter pivot resistance at $150.13.
- The relative performance is holding above its WMA and now trying to turn higher.
- In January, the RS line’s break through resistance at line h, indicated that the pullback was over.
- The weekly OBV is now testing its WMA as the good support, line i, was tested on the correction.
- The quarterly pivot is at $120.75 with the 20-week EMA at $120.46.
Next Page: Two More Charts to Study
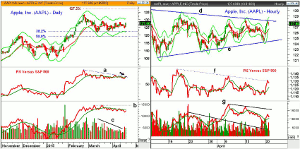
|pagebreak|The daily chart of Apple, Inc. (AAPL) shows the strong close Monday above its 20-day EMA which is now at $126.08.
- There is further support on the daily chart at $124.46 and AAPL made a low in late March of $122.60.
- The 38.2% Fibonacci support was slightly violated at the March low of $121.63.
- Initial resistance on the daily chart at $128.57, which was last week’s high.
- The daily starc+ band is at $130.38.
- The 127.2% Fibonacci retracement resistance target is at $137.20.
- The daily RS line has just moved slightly above its downtrend, which may be an early sign that AAPL is now ready to outperform the S&P 500.
- The volume over the past month has been low (line c), which is typical of a pullback in a strong market.
- The daily OBV is trying to turn up but is still below its WMA.
- The OBV has key resistance now at line b.
The hourly chart of AAPL gives one a short-term view of its triangle, or flag formation, lines d an e.
- The downtrend was tested Monday with initial support now at $127-$127.20.
- The 20-hour EMA and further support is in the $126.60 area.
- The hourly RS line has just barely overcome its downtrend, line f, but has not yet confirmed a new uptrend.
- The hourly OBV broke its downtrend in early April and is still holding above the breakout level.
- The hourly OBV is now back above its WMA and it needs to move through resistance at line g to confirm that the correction is over.
What it Means: In last week’s Profit Taking Levels for SPY, IWM, and QQQ, I presented a strategy on taking partial profits in the SPY, IWM, and QQQ on a upside breakout. This could happen this week. If stocks fail to breakout by Wednesday, one can not rule out another sharp setback and a higher weekly close is important.
The correction has set-up some good buy the dip opportunities using the strategies I discussed in last week’s Four Tips for Buying the Dip.
Though there are no fully confirmed new buy signals in Apple, Inc. (AAPL), they could come in the next day or so. Traders went 50% long Apple, Inc. (AAPL) in January and think now is another good buying opportunity.
How to Profit: Traders go 50% long Apple, Inc. (AAPL) at $127.54 or better and 50% long at $125.12 with a stop at $119.47 (risk of approx. 5.4%).
Portfolio Update: Should be 50% Apple, Inc. (AAPL) at $110.72 or better. Raise the stop now to $119.47.
Traders are 100% long the iShares Russell 2000 (IWM) at an average price of $115.92. Sell ½ the position at $129.32 or better and use a stop at $119.17.
Traders are 100% long the Spyder Trust (SPY) at an average price of $200.50. Sell ½ at $214.16 or better. Raise the stop to $203.88. On a move above $212, raise the stop further to $206.83.
For the PowerShares QQQ Trust (QQQ) should be 100% long at $106.73 with a stop at $102.12. On a move above $109.20, raise the stop to $104.13. Sell ½ at $113.17.


