The healthcare stocks—including biotechnology—have been leading the market higher, so MoneyShow’s Tom Aspray takes to the charts to determine if they are ready for a move to new highs and if two healthcare picks are ready to complete their corrections.
Stocks continued to grind higher on Monday as both the Dow Industrials and S&P 500 closed at new highs again. More importantly, the S&P 500 and S&P 1500 A/D lines have turned sharply higher and are acting much stronger than prices. This is a sign that the stock market can still move significantly higher.
The EuroZone markets were also sharply higher as the euro has turned lower, which made their exporters again more attractive. As noted in Are These Key Markets Changing Direction? there were signs over a week ago that the dollar was bottoming out. The Dax is currently trading above the prior two weeks’ high so this week’s close could be important.
For much of this bull market, the healthcare stocks—including biotechnology—have been leading the market higher. Their recent strength suggests that they may now be ready for a move to new highs and two of our healthcare picks are still trying to convincingly complete their corrections.
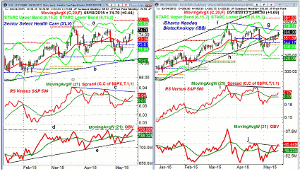
Chart Analysis: The daily chart of the Sector Select Health Care (XLV) shows the doji close last Friday above the downtrend, line a.
- There is monthly pivot resistance now at $76.12.
- The completion of the trading range from the March highs has upside targets in the $77-$79 area.
- The monthly pivot at $72.61 was tested last week.
- The daily relative performance has risen back above its WMA but is still below the resistance at line c.
- The daily OBV does look stronger as it has already moved to new highs as resistance at line d, has been overcome.
- Both the weekly RS and OBV studies are above their WMAs but have not yet made new highs.
- The 20-day EMA is at $73.39 and has now turned higher.
The iShares Nasdaq Biotechnology (IBB) was up over 1.3% Monday and has regained its former uptrend, line h, which had been broken in late April.
- The daily downtrend, line g, is now in the $362.50 area with the last swing high at $368.25.
- In March, the high was $374.97 with the monthly pivot resistance at $381.82.
- The daily relative performance has been back above its WMA since May 8.
- It needs to overcome the resistance at line i, to confirm that the correction is over.
- The daily OBV shows a short-term bottom formation as it has turned up from its WMA and overcome short-term resistance.
- Both the weekly OBV and RS lines are above their WMAs.
- There is initial support at $351.39 with the monthly pivot at $34.17.
Next Page: Two More Healthcare Stocks to Watch
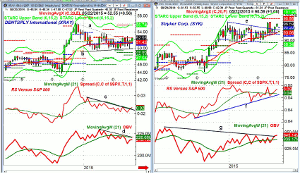
|pagebreak|DENTSPLY International (XRAY) appeared to have completed its continuation, lines a and b, five weeks ago, but, so far, it has not rallied sharply.
- Initial weekly resistance at $52.96 and a close above $53.77 should signal upward acceleration.
- The weekly starc+ band is at $55.74, which also corresponds to the monthly pivot resistance.
- The upside targets from the flag formation are in the $58-$60 area.
- There is important support and the quarterly pivot at $51.34-$49.89.
- The weekly RS line has broken its short-term downtrend, line c, and is just barely above its WMA.
- The weekly OBV is looking much weaker as it dropped sharply over the past few weeks.
- The OBV is now well below its declining WMA so any rally needs to be watched closely.
- The daily OBV is acting much stronger as it is back to the early May highs.
Stryker Corp. (SYK) closed impressively above its downtrend, line e, five weeks ago as it hit a high of $97.44 before reversing sharply to the downside.
- On the reversal, the quarterly pivot at $92.51 was violated with a low of $91.78.
- There is resistance now at the recent highs with the quarterly pivot resistance at $98.86.
- The weekly starc+ band is at $101.48.
- The weekly relative performance tested long-term support, line f, four weeks ago before moving back above its WMA.
- The weekly downtrend, line g, is now being tested and the OBV will look strong with a higher close this week.
- The daily technical studies are positive.
- There is initial support now at $94.88 with the rising 20-day EMA at $94.14.
What it Means: A strong close in the healthcare and biotech stocks this week would be another bullish sign for the stock market. On the downside, a decisive break in XLV below the $70-$71 level would be a very negative, but that does not look likely at this time.
As for DENTSPLY International (XRAY) and Stryker Corp. (SYK), they need to see some more impulsive action in the next few weeks to confirm a new uptrend.
Portfolio Update: For Stryker Corp. (SYK) should be 50% long at $93.88 and 50% at $92.76, with a stop $91.47. Sell 1/3 at $103.77.
For DENTSPLY International (XRAY) should be 50% long at $51.32 and 50% at $50.46. On a move above $53.80, raise the stop from $49.22 to $50.64. Sell 1/2 at $55.08 or better.


