A weak rebound followed by another strong down day will indicate we’re going to see a deeper correction, so MoneyShow’s Tom Aspray takes a technical look at four stocks that generated new warning signals last week to determine if they look poised to go even lower.
On Tuesday, traders seemed to focus on the weak durable goods and continued soft data on manufacturing as stocks opened. The selling increased going into lunchtime as the major averages did not stabilize until the last hour of trading.
The A/D ratios were solidly negative Tuesday as all the major A/D lines dropped sharply. The ARMS Index closed Tuesday at 2.20, which is the highest and most oversold reading since it hit 2.64 at the March lows. It would take another day of heavy selling to push it even higher.
Tuesday’s drop is likely to cause a further decrease in bullish sentiment as just over 25% were bullish last week, according to AAII. If the market can stage a strong rebound over the next few days, it will support the view that this decline was indeed a buying opportunity.
However, a weak rebound followed by another strong down day will indicate we are going to see a deeper correction. The Spyder Trust (SPY) is already testing its daily starc- band with next support in the $208.50-$209.50 area. There is more important support on a closing basis in the $207 area.
These four widely held stocks generated new warning signals last week, but how low can they go?
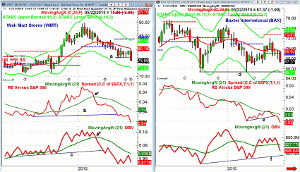
Chart Analysis: The recent disappointing earnings from retailing giant Wal-Mart Stores (WMT) hit the stock hard as it is facing competition on several fronts.
- The weekly close below the five week trading range, line a, reinforced its weak technical outlook.
- WMT lost another 1.27% in Tuesday’s session on 150% the average volume.
- The weekly starc- band and the next downside target is at $73.02.
- For June, the monthly pivot support is at $71.43.
- Four weeks after the high at $89.86, the relative performance dropped below its WMA.
- The RS line dropped below important support in late April, well ahead of last week’s plunge.
- The sharp new lows in the relative performance last week warn of further weakness.
- The weekly OBV broke its support, line c, in March well ahead of prices.
- There is initial resistance now in the $77-$77.58 area and the declining 20-day EMA.
Baxter International (BAX) is splitting into two businesses this year but has continued to underperform in 2015 as it is down 7.6% YTD, despite its 3.09% yield.
- The close last week below the support at $68 puts the focus on June’s pivot support at $66.54.
- The weekly starc- band is now at $65.31, which corresponds to more important support at line d.
- The relative performance just tested its declining WMA in April as BAX rallied back to resistance.
- The RS line violated its support, line e, three weeks ago, warning of lower prices.
- The weekly OBV held up better until last week as volume increased on the downside.
- The break below its WMA makes the next important OBV support at line f.
- There is minor resistance now at $68 with the declining 20-day EMA at $68.62.
Next Page: Two More Stocks that Generated Warning Signals to Watch
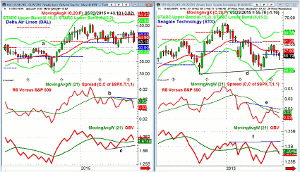
|pagebreak|Delta Airlines (DAL) had held up better than most of the airlines over the past few weeks but dropped 8% last week.
- It lost another 3% on Monday and is now down 14.6% YTD.
- The next important support, line a, is in the $40.80 area, line a.
- The weekly starc- band is at $38.22 with June’s pivot support at $37.59.
- The weekly RS line has been testing the resistance, line b, over the past month before last week’s drop.
- This confirms that DAL is acting weaker than the S&P 500.
- The weekly OBV is still positive as it is above its slightly rising WMA.
- The daily OBV (not shown) dropped below its WMA last week and still looks weak.
- The close Tuesday was on the daily starc- band with resistance now in the $44.26-$44.99 area.
Seagate Technology (STX) rallied from the April lows at $50.58 but stalled in the 60 area in early May. STX is down 16.3% YTD as it dropped another 2.15% Tuesday.
- There is further chart support in the $50.50 area with the weekly starc- band at $50.27.
- The quarterly pivot support is at $41.54.
- The relative performance just rallied slightly above its declining WMA and hit resistance at line e, before it reversed.
- The RS line is still holding above the April lows.
- The OBV retested resistance from early in the year, line f, before it turned lower.
- The OBV is now below its WMA and the daily also looks negative.
- There is resistance now at $56.27, which corresponds to the quarterly pivot as well as the 20-day EMA.
What it Means: A close examination of the weekly charts should be part of all traders planning for the week ahead. It can help you spot the next week’s winners and losers so you can develop new trade ideas.
Two stocks that looked positive after last week were XL Group plc (XL) and Zoetis, Inc. (ZTS). Both were higher Tuesday despite the market’s decline.
How to Profit: No new recommendation.


