If you're the lucky trader who can time entry perfectly, every time, you probably don't need to read this. For the rest of us, reading the signs can be immensely helpful.
By Corey Rosenbloom
Many stock traders are aware of the meteoric rise of Wynn Resorts (WYNN), but new traders often report having difficulty finding that perfect entry into such a popular, strongly uptrending stock.
Let’s take a step back and learn a few tips on running simple breakout and retracement trades into a powerfully trending stock.
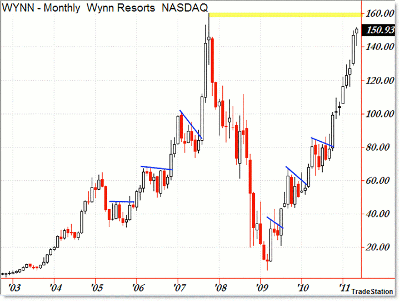
To start, we look at the backdrop of the monthly chart:
I mainly wanted to show the monthly chart to highlight the “character” of this stock long-term.
Namely, notice how the stock makes little retracements, or pull-backs, that last about five to six months. These, in turn, result in a breakout impulse up, as buyers break through the overhead trendline/resistance level.
Also, notice at how powerful this stock has been… excluding the collapse during the Recession of 2008. That’s a lesson in itself that high-flying, volatile stocks do eventually reverse.
With the bigger picture in mind (and the $160 level as an overhead level), let’s drop to the weekly frame:
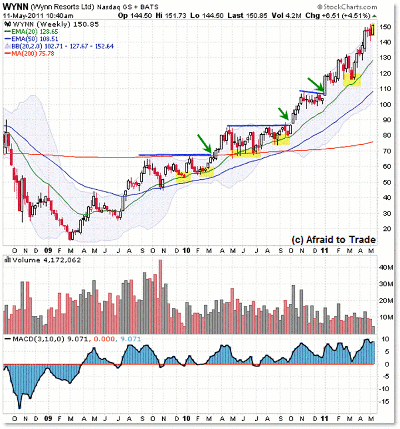
After a clean, positive momentum divergence into the March lows (a very similar pattern in many stocks at that time, and of course the stock-market indexes), a new uptrend formed, which was confirmed with the break to higher highs above the 20- and 50-period exponential moving average (EMA) in July 2009.
From there, price has objectively formed a clean series of higher swing highs along with higher swing lows—the definition of an uptrend.
The weekly EMA structure has also remained positive, and price has rallied up after respective pullbacks/retracements to these rising EMAs—namely, the 20-week EMA.
The tendency for an uptrending stock to find repeated support at rising moving averages gives rise to simple “retracement” trading strategies.
Retracements
Namely, a buyer would enter a position as close as possible to a rising EMA reference level, and ideally drop down to the lower timeframe chart (daily or hourly) to see the structure in price as it “tests” or interacts with this level.
Lower Timeframe Retracement Questions to Ask:
|pagebreak|Lower Timeframe Retracement Questions to Ask:
- “Are there positive divergences?”
- “Are there bullish trendline breakthroughs?"
- “Are there any sort of bullish reversal candles?”
And so on. In this way, you keep your weekly reference level (price) in mind, and then identify lower timeframe structure (looking for bullish signals) in real time, which enhances trade entry/stop-loss tactics.
Most traders report that retracement-style strategies are easier than breakout tactics, so keep in mind your own experience and risk tolerance.
Position or longer-term swing traders (using the weekly chart) tend to trail stops under these rising moving averages accordingly.
Otherwise, if you miss entering on an initial pullback (price runs away from you), you have another opportunity to enter a strongly trending stock on a price breakout above resistance.
Breakouts
I find the easiest way to reference resistance levels is to draw simple trendlines that connect as many price points as possible.
For example, the $70 level in late 2009 was a good reference level, and the price breakout in March 2010 was a good entry into the developing trend structure.
Many traders report that breakouts are difficult, mainly because they see the level clearly in advance, but in real time as the price pushes up to new highs, traders fret that they have “missed the perfect entry” or that the “price is too high already and will pull back the moment I get long.”
The general strategy is to buy as soon as you feel comfortable that the breakout is not a “bull trap,” which also involves studying lower timeframe structure at the point of the breakout (again, daily and hourly charts).
Place the stop under the breakout area and trail upwards accordingly, looking to exit either at a past overhead level, or when the lower timeframe structure shows negative divergences and rising trendline breaks—or some other sell-signal (don’t get short there, just take profits for the time being).
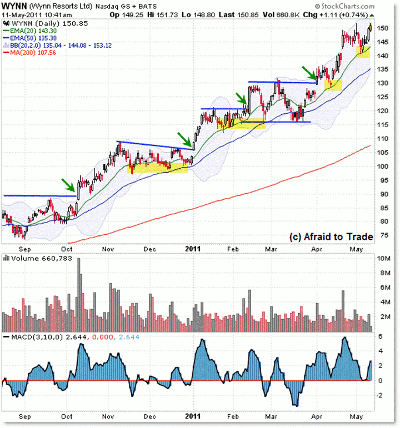
Finally, let’s see these same tactics played on the daily chart:
In both the weekly and daily chart, I label retracement entry zones with highlights, and show breakouts with blue trendlines and green arrows.
I’ll let you study each opportunity instead of describing each one in great detail.
The only threat to the retracement strategy came in mid-March (virtually all stocks fell sharply due to the Japan crisis), when price broke the rising 50-day EMA, but did not break a corresponding horizontal support level (trendline from swing lows) at $115.
As price rallied higher and broke through the overhead resistance at $130, it was “game on” again for bullish plays.
Take a moment to learn and study these simple tactics—don’t over-complicate it. From there, you can use whatever tactics you desire (including options strategies) to play these breakout and retracement opportunities in stocks showing similar powerful uptrends—always using rising moving averages (and trendlines) as references for trend continuity or early potential reversal.
Corey Rosenbloom is a trader and blogger at AfraidToTrade.com.


