
Technical analysis pioneer Richard Wyckoff teaches a unique way to visualize supply and demand in the markets, and using a recent example, we see that Wyckoff’s lesson still “holds water” today.
Most of the wealthy traders in the world have achieved that level of success because they are masters at seeing supply and demand in the markets. They are typically “tape readers” who see supply and demand changing based on order flow and changes in price.
Richard Wyckoff talks a great deal about how to read the tape in his writings. Today, we’ll focus on one of his lessons on how to see supply and demand in the markets where he uses an analogy of a sponge and ink to explain how it works.
The lesson this week comes from Richard Wyckoff’s Studies in Tape Reading and explains how we can visualize supply and demand—absorption and distribution—in the context of a short-term move.
Let’s start with the text and then move to a present day example:
“Just now, I took a small piece of blotting paper [which is like a sponge to ink] and put it on the end of a pin. I then threw a blot of ink onto paper and put the blotter [sponge] into contact. The ink fairly quickly jumped up into the blotter, leaving the paper dry.
This is exactly how the market acts on the tape (price) when its absorptive powers are greater than the supply—large quantities are taken in at the offered prices and at the higher levels. The demand seems insatiable. But after two or three ink blots had thus been absorbed, the blotter would take no more. It was thoroughly saturated. Its demands were satisfied. Just in this way the market comes to a standstill at the top of a rise and hangs there. Supply and demand are equalized at the new price level.”
In this way, Wyckoff describes what happens when a blotter (or sponge with water in today’s terms) absorbs the ink given to it when it is dry.
As the blotter (sponge) takes on more ink (water), there is a point of saturation where no more ink/water can be absorbed. This results in stability.
In terms of price, we can visualize a market at the end of a down move into support where a blotter/sponge appears (think “buying pressure”) to soak up or absorb the sell orders.
As the sell orders are absorbed by the market, price rises until the buyers are satisfied/satiated/finished buying and can thus buy no more.
Wyckoff then turns to describe what happens when supply (sell orders) overwhelm demand (buy orders) just as the blotter (or sponge) can hold no more liquid.
Article Continues on Page 2
|pagebreak|“Then I filled my pen with ink and let the fluid run onto the blotter (sponge). Beyond a certain point, the blotter would take no more. A drop then formed and fell onto the paper. The more I put on the blotter, the faster the drops fell. This is a simple way of fixing in our mind’s eye the principle of opposing forces that are constantly operating in the market: Absorption and Distribution; Demand and Supply; Support and Pressure (Resistance).”
When the liquid overwhelms the capacity of the sponge to take in the liquid, the result is a “distribution” of liquid from the saturated sponge.
Similarly, when supply overcomes demand in the market, i.e. market is “saturated,” then price will fall until another dry sponge (buyers) steps in to absorb the selling pressure.
Alternately, one could say that the wet sponge “wrung out” the liquid and thus dried as water poured out of it and was able to absorb sellers at a lower (dryer) level.
I guess in that sense, one could say that higher prices soak the sponge while lower prices dry it out.
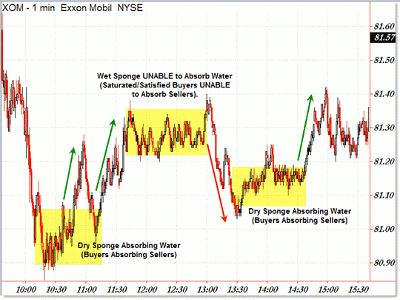
Let’s take a look at an example from earlier this week in Exxon Mobil (XOM) via a one-minute chart:
Click to Enlarge
For simplicity, I’m using the concept of “sponge and water” as opposed to Wyckoff’s “ink and blotter,” but the idea is the same.
A dry sponge is able to absorb sell orders, which drives price higher.
However, as the sponge (buyers) saturates, it can absorb no more sell orders. Instead, the added liquid (sell orders) into a fully saturated sponge results in liquid dripping down from the sponge, or in the case of the market, a distribution occurs which leads to lower prices.
As the liquid is “wrung out” of the sponge, it becomes dry again and can thus absorb the sell orders. Or perhaps a new, dry sponge arises (more buyers) to absorb the sell orders at lower levels.
In XOM (or any example will do), we see the cycle of dry-to-wet-to-dry sponge as price absorbs a morning decline, saturates at the $81.30 level, declines back to $81.00, and then absorbs the sellers with a rally back to $81.40.
Remember, a lot of Wyckoff’s teachings involve price and volume and how supply and demand interact to create trading opportunities.
See video: Profit from Wyckoff’s Timeless Methods
By Corey Rosenbloom, trader and blogger, AfraidToTrade.com


