By using a technical indicator called the Efficiency Ratio, traders can filter out stocks that exhibit choppy or unreliable price action and focus only on the strongest, most tradable trends.
I am always studying my trades to learn what separates my best trades from the rest of the pack. In addition to techniques like Acceleration Bands, CCI, Percent R, and Momentum Divergence, I have noticed that many of the biggest trends I rode were also confirmed by an indicator called the Efficiency Ratio. I refined the Efficiency Ratio as an actionable technical indicator based on the work of Perry Kaufman, a highly-respected systems developer.
In Kaufman’s book, Smarter Trading, he notes that the efficiency of a trend is calculated by dividing the net movement over a certain time period (I use 20 trading days) by the summation of the absolute value of the day-to-day price changes over the same time period.
So, if a stock’s trend is at perfect efficiency, as an example, it could move up, say, 20 points over 20 days, and on each of those days, it moved up by exactly one point. This would mean that the ratio of net movement over combined movement was 20/20, or 1.00 (I plot it as +100 for positive efficiency). If the stock downtrends by 20 points with the same perfect efficiency, its maximum downtrend reading would be -100.
Obviously, it is virtually impossible for a stock to have a perfect efficiency reading, as any adverse movement against the trend during the time period examined will lower the efficiency reading. What I’ve found from my testing is that Efficiency Ratio readings above +30 are very favorable to define persistent uptrends, while readings under -30 often denote steady downtrends.
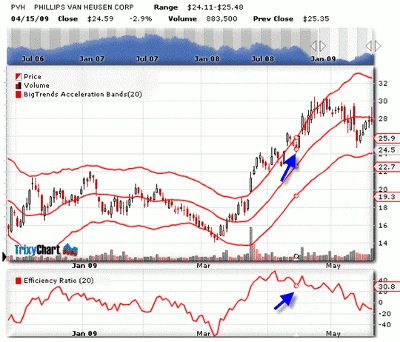
Here’s an example from the past, where we bought Phillips-Van Heusen (PVH) calls when the stock came back to retest its +30 key level on the Efficiency Ratio at the key low of $24.11 (see chart below).
If the stock closed under that level, I would have to exit the bullish trade. The stock quickly rallied up to $30.50 over the next six trading days, allowing me to execute the "free trade" rule of selling half of my position at a +100% gain. Once the next test of the Efficiency Ratio failed in early May, I exited the rest for a still-healthy gain of over 50% and managed to avoid the noise and drawdown that ensued back down to the $25 area.
Phillips-Van Heusen (PVH) Daily Chart with 20-Day Efficiency Ratio
The Efficiency Ratio is a useful filter in your trading arsenal for screening out many choppy stocks where breakouts may prove to be fakeouts, thus allowing you to only focus on the best of the best trends.
By Price Headley of BigTrends.com
This BigTrends.com method for using Efficiency Ratio is not widely available in most trading packages, which makes it even more valuable, in our view. For information on Trading Education products that include Efficiency Ratio, please call 1-800-244-8736.


