The staff at NetPicks.com share simple ideas to get a better picture of what’s going on in the markets and what’s potentially likely to happen next.
Think what it would be like to trade in the pit for a minute (or if you did trade in the pit, think what it was like!!). What would you have with you to help make trading decisions? Some boards with a few simple stats on various products, a pencil and notepad and your eyes, ears and brain. You may well look at your charts before/after you trade to get some ideas of the prices which could well be important to you or you might have noted down a bunch of numbers where you’ve noted interesting price action occurred. Either way you have some prices which you’re keeping an eye on for a reaction. But then what? What do you do when you get a reaction or if you don’t at all? It does, of course, depend on what the reaction is, at which price, what has been done prior to the reaction and what is done at the next price in the market’s line of fire. So you judge the market by its own action at key prices in order to seek out who the strongest party is at any given time. This way, the market is really just moving from point to point making a series of decisions along the way.
So let’s assume you have a way to reliably work out prices, which may hold some interest to the market in the future. Clearly this is only part of the picture as levels are there to be broken. Otherwise we’d be eternally range-bound. So then you need to define the other aspects I’ve mentioned above in order to work out where the balance lies.
What’s the reaction?
1) The market bounces hard.
2) The market hugs the level or area
3) The market breaks through and accelerates
4) The market seems to ignore the level with little to no initial reaction
What’s the price?
1) It’s a very important price
2) It’s not a very important price
What’s the market done before it hit the level?
1) It’s been ranging one way then the other
2) It’s been trending in one direction all day
3) It’s already rejected a level strongly on the other side of the range
4) It’s already tested a level on the other side of the range and struggled to move away strongly
What does the market do next?
See “What’s the reaction?” above for how the market reacts to the next level.
Using these simple ideas a trader, pit or not, can get a better picture about what’s going on and therefore what’s potentially likely to happen next. However, interpreting the market this way isn’t a strategy as such but can be used in combination with a strategy in order to give a trader the confidence of their own convictions.
NEXT PAGE: Putting the ideas into action |pagebreak|
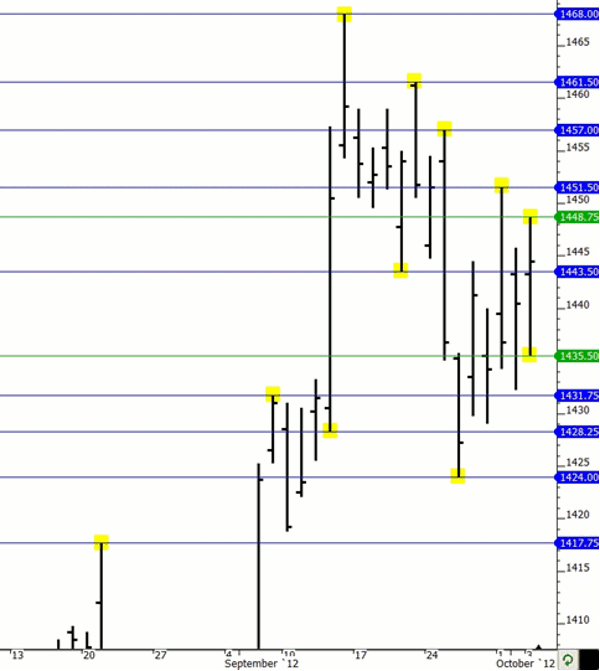
As an example, I’ve looked at some very simple levels from Thursday, in the E-mini S&P 500 (useful nonetheless). I’ve drawn in from the daily RTH (9:30am–4:15pm ET) only chart the obvious swing extremes, the opposite extreme of large bars and the prior session’s high/low. I’m also noting the previous day’s closing price (which is often retested) and the current session opening price (current session high/low would also be worth noting but I haven’t done so here as they weren’t retested).
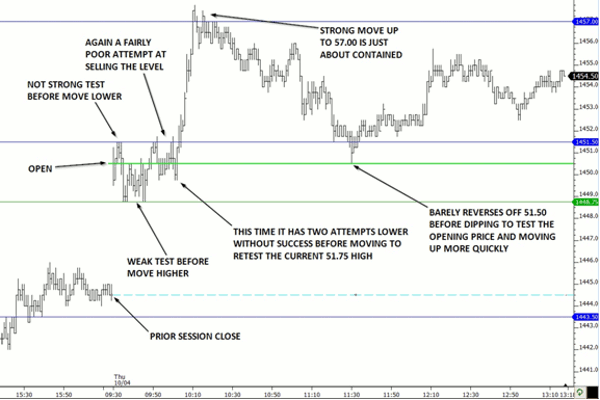
With these simple levels added (and I can assure you I did not cherry pick them) we can take a look at some of the action from the early part of the day. To clarify the situation, I’m writing this as the market unfolds and 1454.50 is the last price (more or less).
So what’s the use of this information? Well, we can see that very early in the session, the market was unsure of what to do. Several attempts to trade lower into the previous day’s range (and possibly towards the previous day’s RTH close) weren’t strong at all, but also the attempts to take out the 1451.50 level weren’t particularly strong either. Then the market resolved this action by breaking higher fairly strongly, possibly validating the higher open.
In the face of the quickly rising market, sellers only just about overcame buyers at the 1457.00 level with it pushing slightly higher to 1457.75. Nevertheless they still managed to overcome the buyers and this fact is important to note. The market then drifted lower to retest the 51.50 level, which did not hold as the test of the opening price was then more important. This held (again, more potential for validation of higher opening) and moved reasonably quickly up away from it.
Breaking this down, we can see that the low, which tested the previous day’s high was not rejected with much conviction. If it were to be retested, it could be susceptible and a move towards the previous day’s close is possible. The high was made on strongish buying and sellers had a bit to do to reverse the market. The strongish move up and subsequent retest and failure of the open suggest the higher open was valid and so there is a chance the highs will be retested at some point.
Given that sellers had to work to hold it the first time around, any break higher could well see a decent continuation. It’s also important to be aware that important economic news can bring in additional activity and significantly alter the current balance of trading activity.
Recognizing how the market moves is important in order to gain that all-important context and give yourself and your strategy a greater chance of success. When the market moves to extremes, decisions are made and depending on the way the market moves, what is likely to happen next might just become a little bit clearer.
This article was written bythe staff at NetPicks.com.


