Whether you’re trading stocks, bonds, ETFs, or commodity futures, being able to gauge the sentiment of the crowd is an undeniably powerful skill to hone, notes Stoyan Bojinov of ETFdb.com.
Quantifying how market participants feel is no easy feat, although there are some tools out there that help simplify this process. Sentiment indicators are valuable tools for helping investors quantify just how “bullish” or “bearish” market participants are feeling at a given point in time; while these indicators may be less than ideal for generating clear-cut buy and sell trading signals, investors can still gain tremendous insights from current sentiment, which can then be used in conjunction with other tools and analysis to confirm price trends and even spot potential reversals.
The inherent value in tracking sentiment indicators stems from a contrarian approach. If we assume that “the crowd” has a knack for selling before the bottom and buying in before the top, then monitoring their sentiment and betting against it accordingly may give you an edge when it comes to spotting potential major turning points in the market. However, as you may have already suspected, simply going against the prevailing sentiment is not a surefire way to make money in the market; as with most things in life, it’s all about your timing. Going against the crowd in the early stages of a bull market can be just as detrimental as following them right to the peak.
For those that are already familiar with the more basic sentiment gauges out there, below we dive into three sentiment indicators that aren’t as talked about, but also stand to offer valuable insights when used in tandem with other tools.
1. NYSE Bullish Percent Index
The Bullish Percent Index (BPI) was originally created by Abe Cohen back in the 1950s and is derived from point & figure charts, which is more than a 100-year old technical analysis technique that plots security prices against changes in direction instead of time (as all other techniques do). The calculations behind this indicator may be over your head, but its application is quite easy to understand:
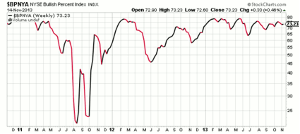
This indicator measures the percentage (%) of equities listed on the NYSE that are exhibiting bullish technical patterns based on their individual point & figure graphs. In essence, the NYSE BPI gives you a general sense of the overall price action in the market, which can be useful for identifying periods of extreme “optimism” as well as “pessimism.” Under normal market conditions, this figure generally oscillates between 40% and 60%, showcasing the tug-of-war between bullish and bearish stocks. When this figure reaches extremes, greater than 80% or less than 20%, it is generally a signpost that the markets are way overbought or oversold, respectively.
NEXT PAGE: 2 More Useful Sentiment Gauges
|pagebreak|In the example above, notice how the NYSE BPI sharply sank lower below 25% in August of 2011; this was the last major correction in the broad market (as of 11/14/2013), so investors who paid attention to this indicator then should have had conviction to buy in and take advantage of the “oversold” conditions at the time.
2. NYSE New Highs-Lows Index
The NYSE New Highs-Lows Index is similar to the NYSE BPI in the sense that it captures overall price action, allowing for investors to identify instances of sentiment extremes. This index is calculated by taking the number of stocks hitting fresh 52-week lows and subtracting that total from the number of stocks hitting fresh 52-week highs.
As you can see, this indicator fluctuates far more than the NYSE BPI, and as such, can be more useful for anticipating short-term price swings. When this Index spikes and reaches extremes, the broad-market tends to reverse at those points; for example, notice how it hit low extremes in July and August of 2013, both of which served as great entry points for swing traders. Likewise, notice how it hit high extremes in September of 2012 prior to market enduring a two month long pullback.
3. Commitment of Traders Reports (COT)
The Commitment of Traders report, COT for short, is easily one of the most valuable sentiment indicators out there. However, because it contains a ton of information, many are quick to wrongfully dismiss it as being “too noisy” or lacking actionable insights. Published every Friday by the Commodity Futures Trading Commission, the COT report shows exactly where commercial, non-commercial, and non-reporting traders are placing their bets across a variety of futures markets.
The most important group to pay attention to is the non-commercial traders, because this includes large institutional investors that are active in the futures market without being involved in the production or distribution of the underlying commodities or assets; in other words, the COT report can show you how the “big players” on Wall Street are positioning themselves in the futures markets. The single greatest limitation of the COT report is the fact that it’s inherently delayed because it is published on Fridays, but is based on open interest information from the previous Tuesday.
The Bottom Line
Sentiment indicators can offer valuable insights when it comes to pinpointing market sentiment extremes, allowing for investors to take a contrarian approach while the clouds of uncertainty sweep over Wall Street. As with all tools and analysis, however, sentiment indicators are not without their faults; false sell signals and early buy signals are a common nuance when utilizing these tools, which is why investors would be best off to use these indicators in conjunction with other strategies. As always, investors of all experience levels are advised to use stop-loss orders and practice disciplined profit-taking techniques.
By Stoyan Bojinov, Contributor, ETFdb.com


