Technician Corey Rosenbloom of AfraidToTrade.com takes the pulse of the market through its various sectors and their performance year-to-date.
With the S&P 500 tipping to a weak all-time high Friday, what does the sector performance grid reveal about the health or weakness of the market?
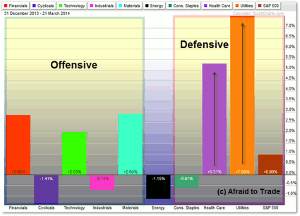
Let’s take a quick glance at the sector rotation model and the message it is sending year-to-date:
According to the sector rotation model, we separate the nine major AMEX Sector SPDRs (ETFs) into “offensive” or risk-on groups (those that tend to do well during a bull market) and “defensive” or risk-off groups (like utilities), which tend to outperform during a retracement or bear market (relative to other stocks or sectors).
With the year-to-date performance, we see clear strength in healthcare (XLV) and utilities (XLU). To expect higher prices in the stock market, we would prefer to see strength in financials, cyclicals, and technology (offensive names) instead of two of the three defensive names.
Nevertheless, utilities are up 7.5% with healthcare not far behind (5.3% gain) so far this year.
While the S&P 500 is up 1%, cyclicals: consumer discretionary (XLY), industrials (XLI), and consumer staples (XLP) all trail the S&P 500 (and all other sectors).
Financials (XLF), technology (XLK), and materials (XLB) form the “middle of the pack” with gains of 2.0% to 3.0%.
The sector performance grid shows a mixed picture with clear bearish or defensive overtones.
Continue watching the grid—and the strength in defensive names—closely with the market diverging at new highs.
By Corey Rosenbloom, CMT, Trader and Blogger, AfraidToTrade.com


