
Walker England of DailyFX.com lays out the steps that traders should take so they can establish a trading bias by identifying the trend and a better understanding of when to buy and when to sell.
Should I be buying or selling? This is probably one of the most frequently asked questions by traders on a day to day basis. The answer doesn’t have to be difficult, if a trader has already taken the necessary steps to develop a trading bias. Today we will examine two ways of forming a trading bias by finding the trend.
Price Action
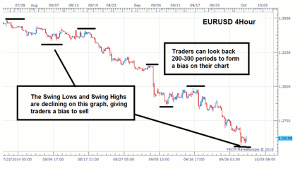
The first way to identify a trading bias is through price action. Traders can view a chart and see if prices are generally rising or falling through the identification of a swing high or low. If prices are getting higher, and the lows are advancing as well, traders should form a bias to buy. In the event that prices are declining—and lower lows and lower highs are being created—traders should have a specific bias to sell. By reviewing 200-300 periods on your chart, this technique can be used with virtually any trading strategy. Let’s look at an example.
Below we can see a EUR/USD 4-Hour chart. Traders will begin their analysis by looking back on nearly two months’ worth of data. This will show traders approximately 300 4-Hour candles. Notice how prices are slowly moving down to new lows for the period selected. This shows that the market is in a downtrend, which can allow traders to form a bias to sell.
Click to Enlarge
Moving Averages
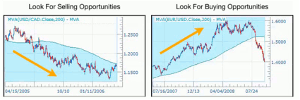
Moving averages are another tool you can use to help determine a trading bias. Normally for this task a 200 period simple moving average (SMA) is used. Traders can apply this indicator to any graph and see if price is either above or below the moving average. If price is above the average, traders can take a bias that the trend is up and look for opportunities to buy.
Conversely, if price is below the average, traders can say that the trend is down while having a trading bias to sell.
Below we can again see the EUR/USD, this time using an example on a 30-Minute chart. The 200-period SMA has been added and price is trading well below the indicator. Knowing this, short-term day traders can take this information and form a bias to look for sell positions. This bias could be held until prices start to move back up towards a higher high and penetrate the average.
Click to Enlarge
By Walker England, Trading Instructor, DailyFX.com


