Perry Kaufman, of KaufmanSignals.com, outlines the qualifiers that come into play when a trader starts to try to define a key reversal and he cites several examples from a historical perspective for support.
I’ve always like key reversals. They seem intuitively correct. Prices open higher then reverse during the day to close lower, after posting higher highs and lower lows than the previous day. If it’s a more volatile day, higher volume, or the end of a good run up or down, I feel even better about it. A bearish key reversal day looks to me like a struggle between buyers and sellers, with the sellers winning and the buyers running away. I would expect no less than a few days of lower prices.
Does it really happen that way? Some traders simply choose to believe it. Others, such as me, need to prove it. However, once you start trying to define a key reversal, it turns out that there are qualifiers. As a discretionary trader, you process these patterns subconsciously, but you do process them. These include:
- Should the daily range be bigger than normal? If the market is very quiet, with relatively low volatility, would an outside day be meaningful?
- Should the key reversal day follow a significant more up or down? In that way, we see it as a top or bottom. How do we define the significant move?
- How many days should we hold the trade after we enter on the close of the reversal day?
- Will higher volume make it a better trade?
If we stay with what seems reasonable, the answers might be:
- Yes, a key reversal should be on higher volatility.
- Yes, it should be the culmination of a significant move, some percentage price change over some number of days.
- Not very long. We expect the key reversal day to cause some concern among traders, but a strong trend will resurface pretty quickly. For our test, we’ll only look at holding the trade a few days to confirm its predictive ability.
- Yes, higher volume is a classic confirmation of a top or bottom.
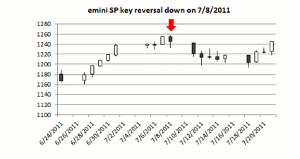
A typical key reversal short sale (shown for the SP futures) looks like the day indicated by the red arrow on the chart below:
Some History
In his Encyclopedia of Chart Patterns (Wiley, 2000), Bulkowski looked at this pattern as a 1-day reversal, concluding that short signals were surprisingly good and longs not as good. The average gain after a reversal was 19% for shorts and 26% for longs. Unfortunately, he didn’t give us the code for his testing. Bulkowski did conclude that better signals had higher volatility, a prior trend, and higher volume. That all seems reasonable.
Our Rules
To make this as simple as possible, we’ve used the following rules:
- A minimum volatility factor based on the average true range (ATR), similar to the daily range but including the gap openings, if any. We always measure the ATR over 20 days.
- A holding period, the number of days we hold the trade before exiting.
- A trend, defined as a percentage move over the prior n days. We always use n=20.
In addition, results are for back-adjusted futures from January, 2002. Costs are $8 per contract per side. Position sizes are determined by an investment of $25,000 divided by the dollar value of the 20-day ATR; therefore, they are volatility-adjusted.
There are a lot of trade-offs in these tests. If we seek moves of more than 5% over 20 days—or raise the volatility threshold—then we severely limit the number of possible trades. We will also limit the holding period to five days or less, just to see if there is a positive short-term response to the reversal pattern. Some analysts may want to target a percentage return or convert a short-term reversal into a longer trade. I admit that is a very narrow test. We’ll skip the use of volume for now because it might reduce the number of allowable trades too much.
NEXT PAGE: What About Bigger Moves?
|pagebreak|Results
- As with some other techniques we’ve tested and traded, key reversals seem to be better with equity index markets than with individual stocks. I’m sure there are stocks that work, but it means that the patterns are more substantial when they are based on broad market movement.
- A volatility factor of 1.25 was used for all results. That means, on the day of the key reversal, the trading range was 25% higher than the average of the previous 20 days.
- A holding period of four days was used for all results. There were no stops or other exits. All trades were exited after four days.
- A commission of $8 per contract per side, $16 round turn, was applied.
Target Move of 5%
We want to look at key reversals from bigger moves, given the sense that they are more important. Of course, if you make to move too big, you’ll get very few trades, so the first table below required a 5% move to occur over 20 days. To be fair, 5% was not the best result for some index markets, but 5% was generally profitable for all of them. A sample is shown in the table below. The profit factor is the gross returns divided by the gross losses, a simple measure of reward to risk.
Note that there was consistently an average of one trade per year, not very exciting. But profits were made in four days based on $25,000. Given an equal reserve of $25,000, the Net Profits for the SP were about $148,000, or $3,000 for each day of trading and 50% per year. Of course, if the trade that year turns out to be a loss, you may need to wait a year to recover it.
Also note that the French CAC and British FTSE were profitable on the long side, not the shorts, even though the percentage of profitable trades was high. It may be that those markets would have done better with a different holding period.
Different Target Moves
While not all markets performed at their best after a 5% target move, most markets did well based on different target moves. The table below shows results using 1% to 4% target moves. One advantage of a smaller target is that there are more trades, which can add confidence to the results. Offsetting that is the lack of consistency across markets, but then different markets may have different volatility.
Conclusions
Unlike Bulkowski, we found that, for our rules, buying key reversals was more profitable than selling. Tests from 2002 included more bullish years than bearish ones, which could account for the difference. Overall, we found that larger moves preceding a key reversal resulted in larger profits.
With only a few exceptions, results were good. The biggest problem is having the patience to wait for a trade.
A Last Note on Volume
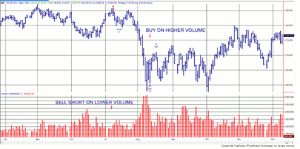
I didn’t forget about volume. The chart below shows two S&P signals with the volume displayed in the lower panel. The sell signal, which occurs first, is on lower volume and the buy signal on much higher volume. That confirms the classic chart interpretations:
- A new high on lower volume is likely to be a false high, and
- A low on high volume occurs as a blowoff, indicating the low of the move.
Volume has not been included as a feature because it often requires interpretation and a volume confirmation would reduce the number of trades. As it stands, there are already too few trades and you might consider the two volume rules given above as contradictory.
By Perry Kaufman, Founder and Editor, KaufmanSignals.com


