
As a follow-up to last week's article, which analyzed investor sentiment from a historical perspective, Chris Ciovacco, at Ciovacco Capital Management, shares a table and video to iterate the importance of remaining open to and prepared for all outcomes (bullish and bearish) in the stock market.
Fear Has Lots of Company
As we noted in What Do 1987, 2003, 2009, and 2015 Have in Common?:
"When investor sentiment reaches extreme levels, it can be a contrary indicator for the stock market. For example, the highest bullish reading in the history of the American Association of Individual Investors (AAII) Sentiment Survey was 75% bulls before the dot-com bubble popped in 2000. To give you a reference point, the average over the life of the AAII survey is 39% bulls. Sentiment readings can also be helpful when they reach extreme levels of skepticism."
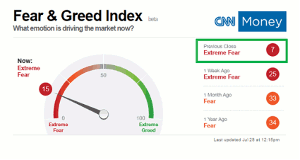
The CNN Fear & Greed Index was sitting at an extreme fear reading of 7 during Monday's session. Mid-day on Tuesday it was still sitting at an extremely fearful reading of 15. This type of reading looks nothing like what we would expect to see near a major market peak; we would expect just the opposite...extreme optimism (see the 75% bull reading before the 2000 market peak).
Click to Enlarge
Are There Other Reasons to Keep an Open Mind?
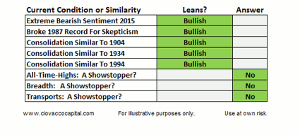
The answer to the question above is numerous. The CNN Fear & Greed Index, a record for investor skepticism—dating back to after the 1987 stock market crash—was recently broken. In addition, when markets consolidate, it speaks to indecisiveness or a more equal battle between bulls and bears. We are all familiar with the expression "the market needs to consolidate its gains." Thus far, 2015 has produced a rare pattern of consolidation similar to ones not seen since 1904, 1934, and 1994. As noted in the table below, all three historical periods of consolidation were followed by big gains in the stock market.
Click to Enlarge
Want More Details?
This week's video provides some additional insight into the reasons to keep an open mind about bullish outcomes table shown above. It also covers recent observable damage to the bullish case.
Video: Bearish Cracks vs. 'Be Patient' Facts
How Can We Use All This?
Any data that tells us to keep an open mind about better-than-expected outcomes must be confirmed by the stock market, which is something that has not happened yet. For example, if the stock market is to rally for the next few months in a surprising manner, that is not possible as long as the S&P 500 fails to make a higher high above 2,134. Our market model does not make decisions based on what may or may not happen. Therefore, the only real value to the table and video above is to help us remain open to and prepared for all outcomes (bullish and bearish). A few reasonable S&P 500 (SPX) guideposts relative to improving bullish probabilities include 2096, 2107, 2116, and 2134. Each push above a guidepost level improves the odds for the bullish case. Below these levels, the expression "the market has some work to do" applies.
By Chris Ciovacco at Ciovacco Capital Management


