I wanted to show in this article how charts can be used to support strategies developed using other tools. I will illustrate this with a trade I took off today where I got short Amazon.com (AMZN) using options. By mid-September, Amazon had run up very quickly from the retest of the 110 gap area to the mid 140′s. It was near the April peak, was getting overbought, as was trading at a price/earnings multiple of something like a gazillion as well! I liked the stock, but not at this lofty level. I started looking for ways to short it. I could have just shorted the stock, but that seemed risky given its quick moves to the upside in the past. I found the answer in an option strategy.
The Set-up
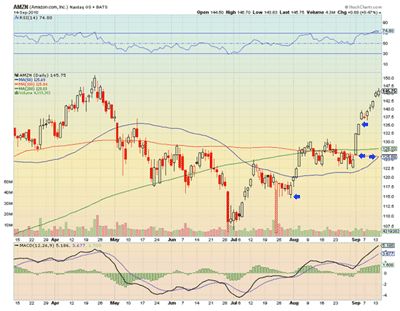
Just below is a chart of Amazon.com as of September 14, 2010. This is the day that I put on the trade. Amazon had just gapped up—again—to 145. My first step was to look for points of possible support on the chart. I have noted four that occur above the 110 gap level at 135, two at “125-ish,” one from the base of the long, white candle, and the other from the convergence of the 50-day and 100-day simple moving averages (SMAs), at 115. I picked these and disregarded others (like 122.50) because they also coincided with Amazon options strike prices. I like to use spreads (buying a close strike and selling a further strike) to limit the downside risk. By selling the downside strike, I also reduce my cost of the spread, but at the same time, cap my possible return.
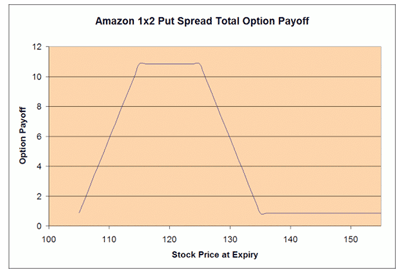
My next step was to look through the expiry calendar to determine where there might be enough time value to create a low-risk, low-cost trade. I needed a series that had enough time value in them to overwhelm the intrinsic value, making the out-of-the-money options relatively more valuable than they would be if they had less time to expiry. My choices at the time were October 2010 and January 2011 or longer. The October options were too close to the expiry and did not have enough time value, so I chose the January options. Looking at the January 135/125 put spread would still cost me $2.89 per spread, $8.65 for the long put less $5.76 for the sold put. Since I like the stock and would be willing to own it below the $110 gap support area, I also looked to sell an additional put on the 115 strike for $3.74. This made the combination with a credit of 85 cents to me for putting it on. It gave me no risk above $135 and paid additional upside of up to $10 if the stock closed at between $125 and $115, starting below $135. Below $115, I still made money until $105, where I would own the stock. Here is the option payoff:
The Outcome
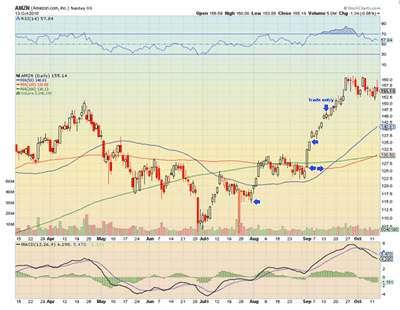
Below is that same chart updated to today, when I took off the trade by selling the combination for one cent. This netted me 86 cents per spread, but look what the stock did during this time: It actually rose an additional $10.
Because I was short an extra put, I did have to post margin of about $1300 per spread. I had been looking to exit the trade recently, as I believe the market is getting more bullish and this was a poor use of cash. My return on that margin over the one month, though, was an annualized 79.4 basis points, or 0.794%, better than most short-term investments.
This type of strategy is not for everyone, but it is not a bad strategy to gain short exposure to a stock, and do so with limited downside, when you have some extra money lying around. The technicals are what got me comfortable with the strikes and facilitated the trade. Use all of your tools.
By Greg Harmon of DragonflyCap.com


