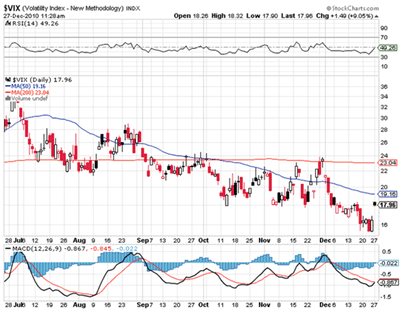
Remember all the way back to April 2010? Spring was in the air, the Mets were still mathematically alive in the National League East race, and the VIX (the Chicago Board Options Exchange volatility index) was near 15. The singing birds obscured the approaching clouds, and before you knew it we had flash crashed our way into a fear blitz.
Slowly but surely we regained confidence. And now just before the winter solstice, the VIX has returned to under 17 for the first time since those heady days. What's more, other options signals have shown signs of complacency. The CBOE all-equity put/call ratio has hovered around .50 and below recently. The ten-day average of the put/call ratio has hit lows last seen in....yes, April.
On Thursday of last week, the ISEE call/put ratio had a one-day pop over 330, meaning the general public option trader bought 3.3 times as many calls as they did puts that day. It's possible the SPDR S&P 500 ETF (SPY) dividend threw that number out of whack, but even if you back that day out, the ten-day average ISEE is at or near post-flash-crash highs.
Remember that it wasn't that long ago that the pundit consensus viewed put buying and elevated VIX levels as worrisome for the market as a whole. At least now we have returned to the pre-2008 world where we (properly) found apathy worrisome.
Here’s a current chart of the VIX:
So does this set us up for panic redux? Of course no one knows for sure. History often rhymes, but it rarely repeats. Just because we have a similarly complacent backdrop now as in April does not mean we will soon see a rerun. When you look back on past intermediate-term tops, you will often see them correspond to objectively low VIX levels. But it's certainly not the case that every objectively low VIX reading leads directly to a market top. And there's of course no magic VIX number that foretells doom.
I personally prefer to watch the VIX through a subjective lens. The VIX tells me more if it does something unexpected. For example, if it acts strong in a dull market, maybe that says there are some worries under the surface that we have not factored in. But if you look either backwards or forwards at the current market, VIX behavior does not strike me as odd at all.
VIX indexes a normalized 30-day implied volatility of a hypothetical Standard & Poor's 500 (SPX) option. The volatility of SPX options depends on both the volatility of individual component stocks in the SPX, and the degree to which those stocks themselves correlate. The higher the individual stock volatility, and the greater the stock moves correlate to one another, the greater the volatility of SPX itself, and the more an investor will be willing to pay for SPX options.
Right now, both factors have hit the skids. The CBOE S&P 500 implied correlation index has many flaws, but it gives a decent objective window into correlation of S&P 500 components. And it recently hit lows not seen since mid-May. Meanwhile, realized volatility in some individual names has hit almost unthinkable levels. Ten-day realized volatility in Apple Inc. (AAPL) sits at about 7.5, down from 28 as recently as a month ago. Exxon Mobil (XOM) is about 5, versus 20 last month. Procter & Gamble (PG) has halved from 16 to 8. And so on.
That all looks backwards, though. Traders of course consider the rearview mirror when bidding and offering options, but they price forwards. The VIX is a proxy for expectations about volatility of the S&P 500 for the next 30 days. But a look into the future does not provide much hope for a volatility rebound any time soon.
Suppose you peered out in time from Friday, December 17. First up was a weekend, followed by a holiday-shortened four-day week that historically sees low volume and light volatility, followed by a three-day weekend, followed by another holiday-shortened week and long weekend. It's a full 17 calendar days before we can reasonably expect normalcy to return. So who would willfully pay full fare for an option with 30 days of life remaining if the first 17 of those days figure to see subnormal activity and volatility?
The answer is nobody. Traders literally move their calendars forwards in time. They would price a 30-day option as if it has maybe only 20 or 25 days remaining until it expires. This translates to paying a lower implied volatility for options across the board, and hence a lower statistical reading in indexes like the VIX.
So yes, the VIX looks very low to the untrained eye—and even to the trained eye. But it's at reasonable levels considering the current backdrop. It will likely nudge back up as soon as we slog on, but that has more to do with the calendar catching up to options pricing rather than any real change in volatility assumptions.
By Adam Warner of Daily Options Report


