Volatility is a trader’s friend, but with the VIX falling a record 39% last week, what’s a trader to do? Trader and blogger Mark Sebastian of OptionPit.com has a couple of plays for the current environment.
I was asked by several different media groups why the VIX was so low. After all, the VIX was just over 22% on December 28 (a 52-week high); one week later, it is trading at a 52-week low. Our answer was simple, the VIX is so low because it should be this low.
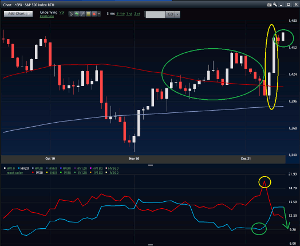
In the chart below, I point out when the VIX hit its peak on December 28, 2012 (the yellow circle). I also point out that IV was 'predictive' of the movement that we saw on Monday and Wednesday (also in Yellow), when the S&P futures rallied 75 points in two days.

Livevol® www.livevol.com
Click
to Enlarge
Notice that prior to the big moves, 20-day realized volatility (a one-month measure) was in the toilet; it was below 10%. We can see the total lack of movement in the chart. The IV rallied, but the market movement wasn’t there until Monday. Now that we have 'the news' out, the market is finally matching options prices to actual market movement for the time being. What has been happening since Wednesday, the market expects to persist. If that persists, expect that realized vol number to fall back below IV and the VIX to stabilize.
The Trade
It looks like IV is going to be between 14-17 for the time being. If the market crawls higher, then we think a bullish butterfly with a January expiration time frame has real odds of success. It should maybe be placed around the 1475 strike. We also like owning VIX put spreads in January, as the VIX may actually settle in the 14's.
By Mark Sebastian,Blogger and Contributor, OptionPit.com


