
While the Bid and Ask price for each option is the minimum amount of information needed in order to trade, options instructor Russ Allen, of Online Trading Academy, offers a more in-depth explanation of the additional information that also goes into most option chains.
The option chain is the list of available options. Today, we’ll look more deeply at the option chain.
The example below represents the most minimal useful form of the option chain, which looks like this:
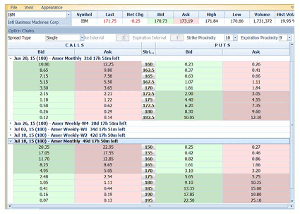
Click to Enlarge
The chain above shows only the Bid and Ask prices for each option. This is the minimum amount of information we need in order to trade. It shows us at what prices we could buy or sell each option.
There is additional information that is included in most option chains. Here is a typical presentation:
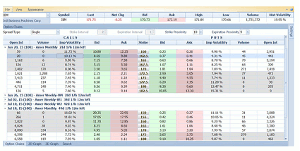
Click to Enlarge
We now have more information. Here is a capsule description of each item:
Imp Volatility: The rate of expected future price movement of the stock that is built into the option’s price. For the June 170 calls, for example, this is 8.06%. That means roughly that the current price of the option (the midpoint between the bid of $3.50 and the ask of $3.65) indicates that option buyers and sellers expect IBM to move at a rate—between now and the option expiration in 21 days—that if continued for a year, would result in a range that is centered around the current price of IBM, but could be as much as 8.06% higher or lower. The more people are willing to pay for this option, the higher the implied volatility reading will be.
The relationship between option prices and implied volatility is defined by the option pricing model, or formula, that was published by mathematicians Black and Scholes in 1973.
Note that there is a separate Imp Volatility value for each individual option and that they are different from each other. This difference in implied volatility from one option to another doesn’t really mean that the buyers of different options expect different amounts of movement for the same stock. It is actually an indication that the part of the Black-Scholes option pricing formula that relates implied volatility to option prices is flawed, with respect to options whose strikes are far away from the current stock price. The formula assumes that these far-away prices are less likely to be reached than they really are. So the market (real live humans who buy and sell options) votes with its prices accordingly.
The Implied Volatility figures for all of the separate options for a given stock are aggregated together into a weighted average, which is referred to as the implied volatility of that stock. We can chart implied volatility for the stock over time. We can then say something about the current level of implied volatility compared to its observed levels over that time. If the current level is high, then we conclude that people are currently paying high prices for the stock’s options…maybe too high. We’d then want to look for opportunities to take advantage of this overpricing by selling that stock’s options short. If, on the other hand, we found that the current level of implied volatility was unreasonably low, then we’d be more interested in buying that stock’s options, rather than selling them short.
Volume: This is the number of options that changed hands today. We’d prefer this number to be consistently high: at least in the hundreds of contracts per day for the most popular options (the ones with strike prices near the current stock price). If there is low volume in the options for a stock, then the option market makers will have little competition and will quote the options with a wide bid-ask spread. That spread is a cost to us and we want it to be small.
Open Int: This is Open Interest, the number of option contracts that are currently outstanding. This number is constantly expanding and contracting. As the demand for a stock’s options increases, new option contracts are created to fill the need, causing open interest to increase. When more option trades are being closed than opened, then the total open interest goes down. Most options that are created end up being closed out before they expire.
Like volume, a big number for Open Interest indicates a lot of activity in this company’s options, which probably means that many traders are involved. Once again, that means competition for the market makers, which causes their spreads to be narrower than otherwise. We’d like to see the open interest on the near-month options in the tens of thousands when all of the strikes are added up. Otherwise, the stock is not suitable for us to trade.
Remember to stick to options with large numbers for open interest and volume and small bid-ask spreads.
By Russ Allen, Instructor, Online Trading Academy


